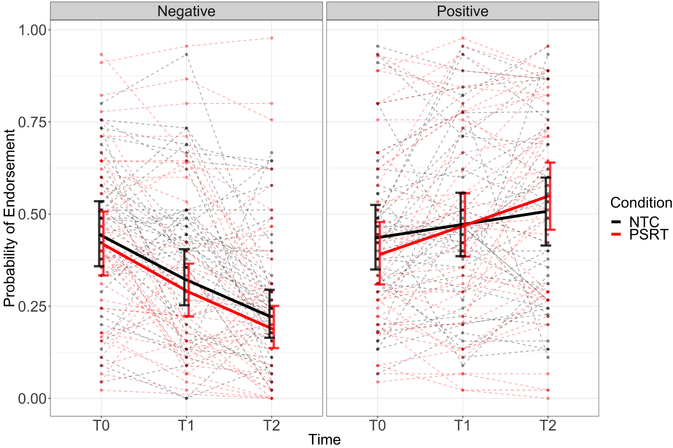
Figure 3:
Change in probability of endorsing words over time, presented separately for negative (left) and positive (right) words. The PSRT training condition is presented in red; the NTC training condition in black. Dashed lines show individual participants’ trajectories. Solid, thick lines show the linear trend of time as estimated by the logistic regression mixed effects model, with error bars demonstrating 95% CIs around the estimates at each time-point. The probability of endorsing negative words fell for each group, while the probability of endorsing positive words increased more for the PSRT group than for the NTC group.

