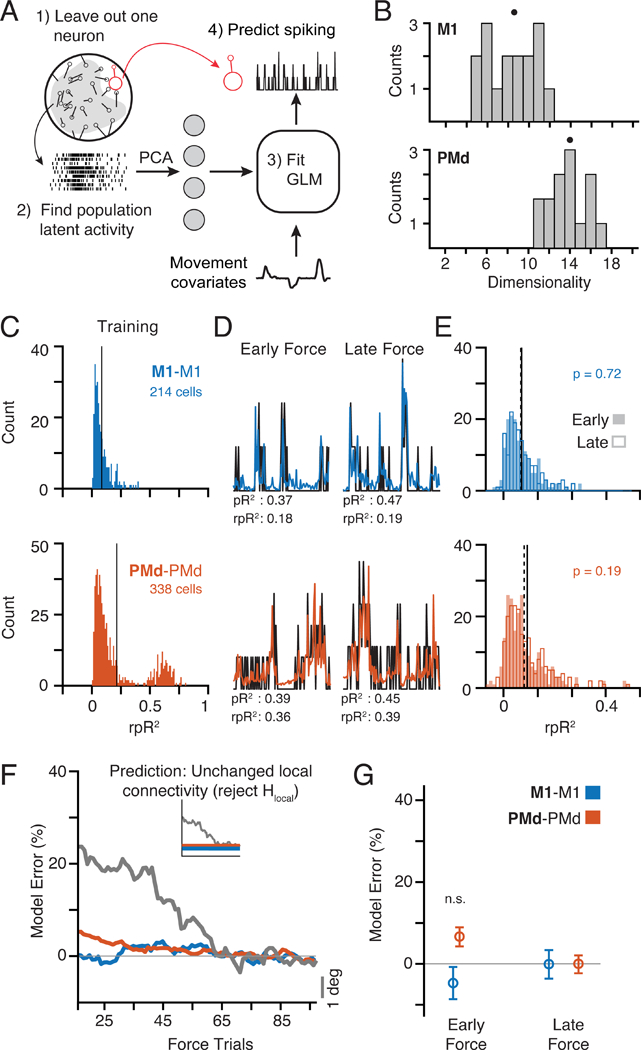
Figure 3. Predicting neural spiking with GLMs.

a) We trained GLMs using movement kinematics as well as the latent activity of the population of neurons within an area to predict the spiking of a single left-out neuron (see Methods). b) Histogram of dimensionality estimates for M1 (top) and PMd (bottom) manifolds across all sessions from both monkeys. Dots above each distribution indicate the median. PMd activity was consistently higher-dimensional than M1. c) We trained GLMs (M1-M1, blue, and PMd-PMd, orange) using data from the end of Force after behavior had stabilized and tested them for generalization throughout the initial phase of adaptation, beginning at the first CF trial (Early) and tested once behavior plateaued (Late). The left histograms show the distribution of rpR2 for all neurons (pooled across nine sessions) with significant GLM fits (Figure S5; see Methods) based on a cross-validation procedure in the training data from the end of Force. d) Spiking for representative neurons (black) and model predictions (colors) during three Early ((highest behavioral error) and Late (lowest error) adaptation trials. e) Histograms of rpR2 values for predictions in the Early and Late blocks. We compared Early (hollow bars; mean: dashed line) and Late (filled bars; mean: solid line) Force trials. M1-M1 and PMd-PMd had similar distributions during Early and Late. f) Time course of model performance changes. Predictions were made for individual trials, and then smoothed with a 30-trial window (see Methods). The horizontal axis labels represent the center-point of this window. Plotted data indicate the mean across all neurons. Trial-to-trial behavioral error processed with the same methods is overlaid in gray and scaled vertically for comparison (gray scale bar on left). The inset replicates our hypothesis prediction from Figure 1. g) Percent error in model performance during the Early and Late adaptation trials as in Panels D and E. No effects were significant (two-sample t-test). See also Figures S1-S7.
