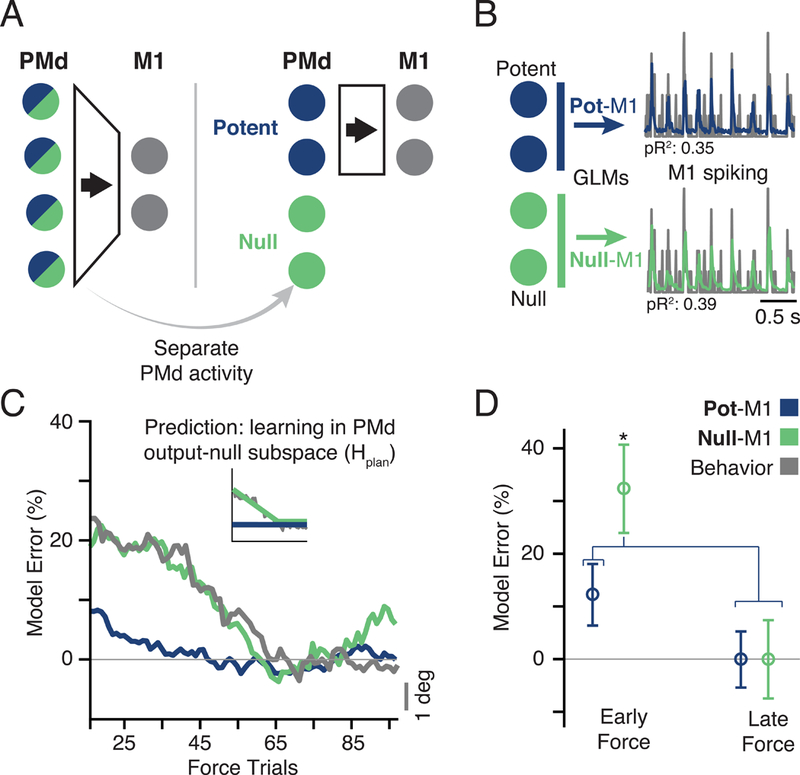
Figure 4. Predicting M1 spiking from PMd output-potent and output-null subspaces.

a) Hierarchical schematic of motor planning in PMd and M1. The PMd population activity is higher-dimensional, giving extra degrees of freedom at the input to M1 (Figure 3B). We devised an analysis to separate the putative PMd outputs to M1 from the other functions of the population. The former comprises the output-potent subspace, while the latter reside in the output-null subspace. b) The output-potent and output-null activity of PMd were used as the inputs to a GLM model to predict M1 spiking. c) The time course of model performance for Pot-M1 and Null-M1 for all sessions. Plots formatted as in Figure 3F. Gray line is the same behavioral error plotted in Figure 3F. Interestingly, the Null-M1 error alone paralleled the time course of behavior. d) The bar plot compares model error performance during early and late trials with outputpotent (Pot-M1) and output-null (Null-M1) activity. The performance of Null-M1 was significantly decreased during adaptation (asterisk indicates significant difference at p < 0.01, two-sample t-test). See also Figures S5–7.
