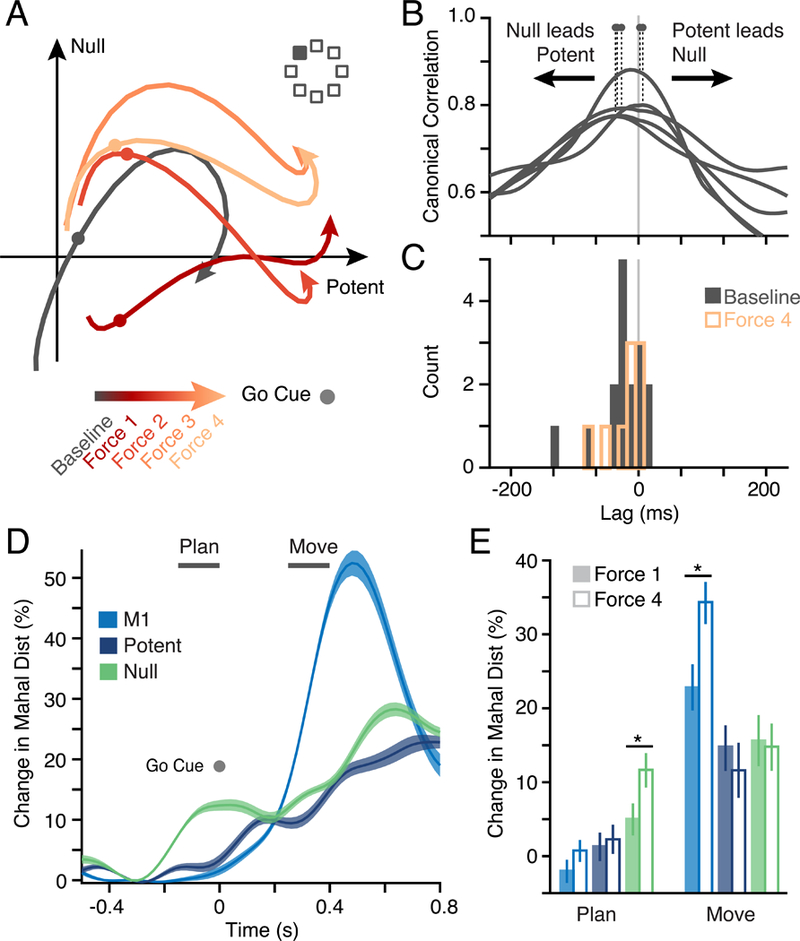
Figure 6. Output-potent and output-null activity during CF adaptation.

a) Examples of PMd subspace activity during one CF adaptation session for a single reach direction (filled square) averaged in four blocks of trials. Activity within both null and potent subspaces changed with adaptation. b) We used Canonical Correlation Analysis (CCA; see Methods) to compare the output-null and output-potent activity at different time shifts to identify their relative lag. The first canonical correlation value is shown for five example sessions. Dots indicate the lag with peak correlation. A peak left of zero indicates that output-null leads output-potent activity. d) Peak lag across Baseline for all 16 CF and VR sessions (black histogram). Output-null activity preceded output-potent by 35 ms on average, and the distribution was significantly negative (t-test; p = 0.02). The distribution obtained from the end of the Force period for the CF sessions (9 sessions) is overlaid in red. d) Analysis of neural state shows a progressive change in activity in both subspaces during adaptation. We computed a normalized Mahalanobis distance across all trials in a time window aligned on the go cue, which represents the separation of the instantaneous neural state from that of the Baseline. The plot shows the mean and s.e.m. across all CF sessions in Late adaptation for both M1 and the two PMd subspaces. e) A comparison of average change in relevant windows for planning and movement (indicated by horizontal bars in Panel D) in the Early (solid bars) and Late (hollow bars) phase of the Force epoch. Asterisks indicate significance at p < 0.05. Changes in planning activity predominantly occurred in the output-null subspace.
