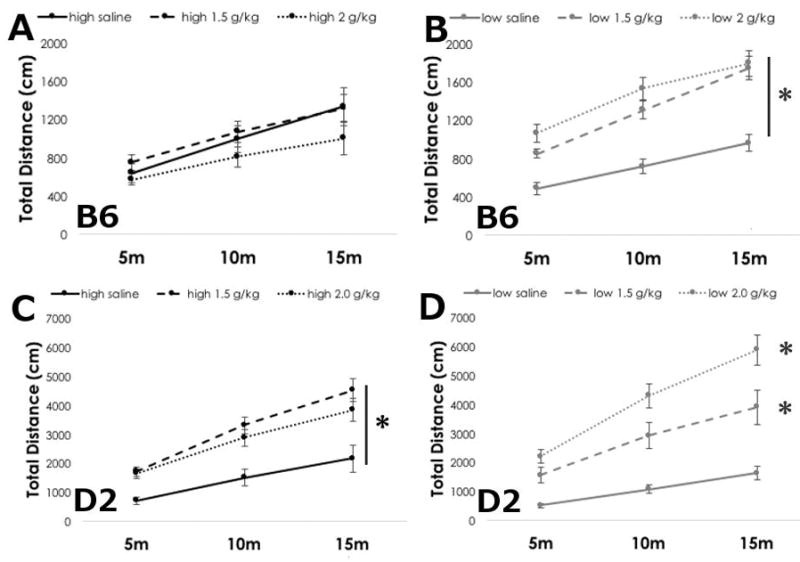
Figure 1. Ethanol locomotor activation is lower in B6 and D2 mice fed a high ω-3 diet.

Mean +/− SEM cumulative locomotor activity of B6 mice on (A) high ω-3 diet or (B) low ω-3 diet after saline, or ethanol at 1.5 and 2.0 g/kg. Mean +/− SEM cumulative locomotor activity of D2 mice on (C) high ω-3 or (D) low ω-3 diet after saline, or ethanol at 1.5 or 2.0 g/kg. *p<0.05 vs. saline, main effect of diet by RM ANOVA.
