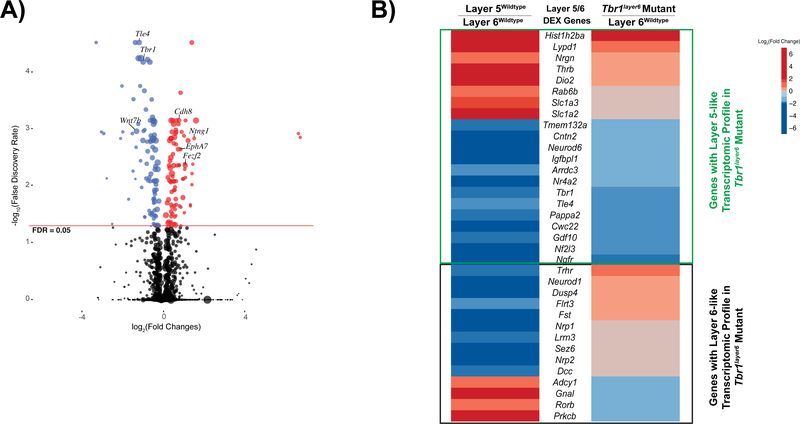
Figure 1. Tbr1 transcriptional regulation in the neonatal cortex.
(A) Volcano plot of genes up-regulated (red) and downregulated (blue) in FACS purified layer 6 neurons from P5 Tbr1layer6 homozygous mutant SSCx. Black dots represent the genes that did not reach statistical significance (adjusted p value > 0.05). The size of each point represents the difference in the median gene expression between Tbr1wildtype and Tbr1layer6 mutant (large dots mean large differences). (B) P5 transcriptomic comparison of DEX genes between layer 5wildtype vs. layer 6wildtype and Tbr1layer6 homozygotes vs. layer6wildtype. With respect to genes that mark wildtype layer 5 (red genes), we observed eight genes with increased expression in the Tbr1layer6 mutants (p < 0.05). With respect to genes that mark wildtype layer 6 (blue genes), we observed 13 with reduced expression in the Tbr1layer6 mutants (p < 0.05). However, there were 14 of the layer 5 and layer 6 marker genes whose expression did not significantly change in the Tbr1layer6 mutants (Fig. 1B). Genes with layer 5-like transcriptome profile (green box) and layer 6-like expression profile (black box) are indicated. See also Figure S1 and Tables S1, S2 and S3.

