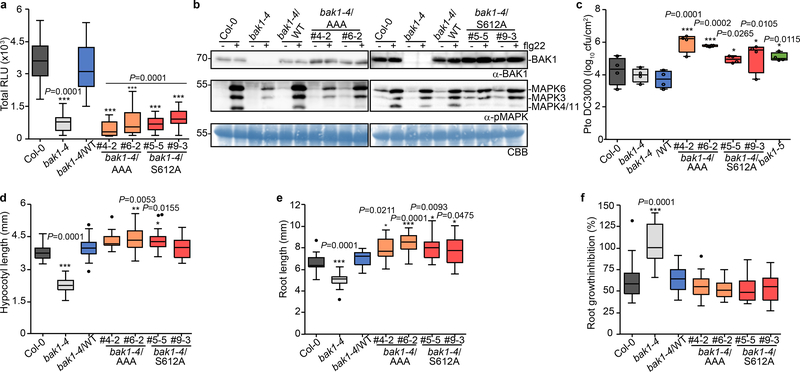
Figure 1 |. Phosphorylation of the BAK1 C-terminal tail is critical for immune signaling.
a, Total ROS production following treatment (n=12 biologically independent leaf discs) with 100 nM flg22 over 60 min. RLU, relative luminescence unit. b, MAP kinase activation 5 min after treatment of 10-day-old seedlings with 100 nM flg22. Coomassie brilliant blue (CBB) was used as loading control. For blot source data, see Supplementary Figure 1. c, Growth of Pto DC3000 at 3 days post-inoculation. Plants were sprayed with a 108 cfu/mL bacterial suspension. n=4 biologically independent plants. Circles indicate the individual data points. d, Hypocotyl length of dark-grown 7-day-old seedlings grown on medium supplemented with 2 μM BRZ. Biologically independent hypocotyls: Col-0 (n=19), bak1–4 (n=27), bak1–4/WT (n=28), bak1–4/AAA#4–2 (n=18), bak1–4/AAA#6–2 (n=22), bak1–4/S612A#5–5 (n=33), bak1–4/S612A#9–3 (n=29) e, Root length of light-grown 7-day-old seedlings grown on medium supplemented with 2 μM BRZ. Biologically independent roots: Col-0 (n=21), bak1–4 (n=21), bak1–4/WT (n=21), bak1–4/AAA#4–2 (n=25), bak1–4/AAA#6–2 (n=27), bak1–4/S612A#5–5 (n=24), bak1–4/S612A#9–3 (n=25) f, Relative root growth inhibition of light-grown 7-day-old seedlings treated with 5 nM BL. Control and treated media were supplemented with 0.5 μM BRZ. Root length growth inhibition by BL was calculated relative to the untreated control for each genotype for the following numbers of biologically independent roots: Col-0 (n= 17), bak1–4 (n= 23), bak1–4/WT (n=24), bak1–4/AAA#4–2 (n=25), bak1–4/AAA#6–2 (n=27), bak1–4/S612A#5–5 (n=22), bak1–4/S612A#9–3 (n=23). a-f, Experiments were repeated independently three times. Measurements are plotted as boxplots displaying the first and third quartiles, split by the median; whiskers extend to a maximum of 1.5 × interquartile range beyond the box. Outliers are indicated as black dots. Statistical analysis was performed using one-way ANOVA with Dunnett’s post-hoc test compared to the bak1–4/WT.

