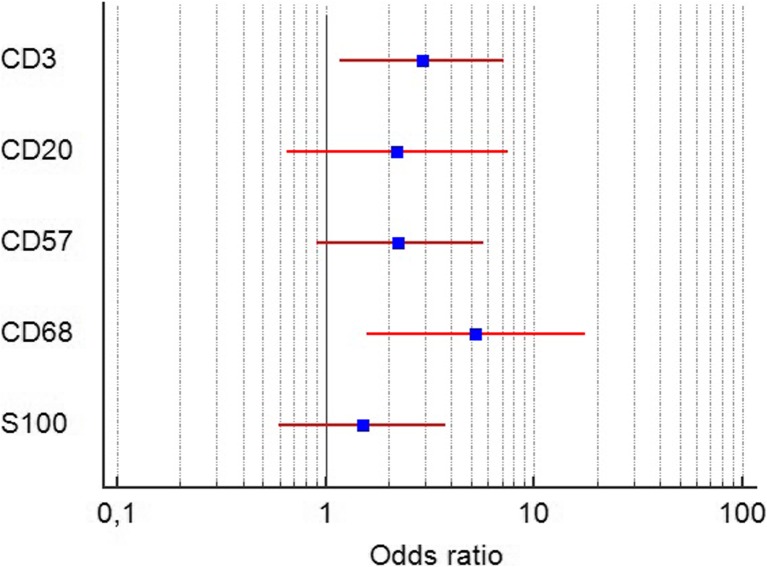
Fig. 4.
Forest plot represents odds ratio and 95% confidence interval of the association between infiltration by each type of immune cell and MELF-pattern stromal changes. The result of analysis showed statistically significant association between decrease of TAT and TAM and presence of MELF-pattern. Abbreviations: CD3 – tumor-associated CD3+ T-lymphocytes; CD20 – tumor-associated CD20+ B-lymphocytes; CD57 – tumor-associated CD57+ NK-lymphocytes; CD68 – tumor-associated CD68+ macrophages; S100+ − tumor-associated S100+ dendritic cells

