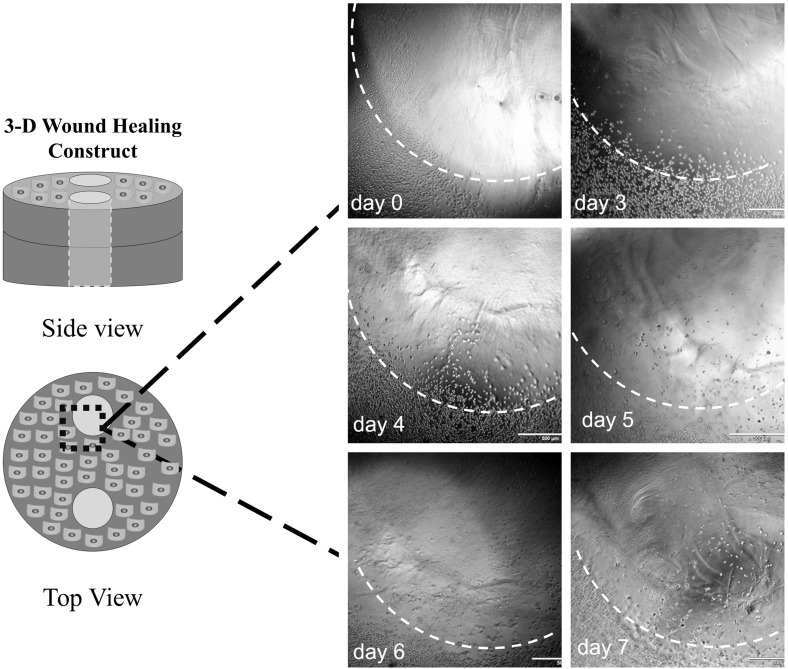
Fig. 2.
Representative bright field images used to measure keratinocyte migration toward the center of fibrin-filled defect (wound) in the 3D collagen constructs from day 0 to day 7 (scale bar = 500 µm). The perimeter of the fibrin wound is marked with a dashed white line. Diagram shows the region of interest used to measure keratinocyte migration. Note the illustrations are not drawn to scale

