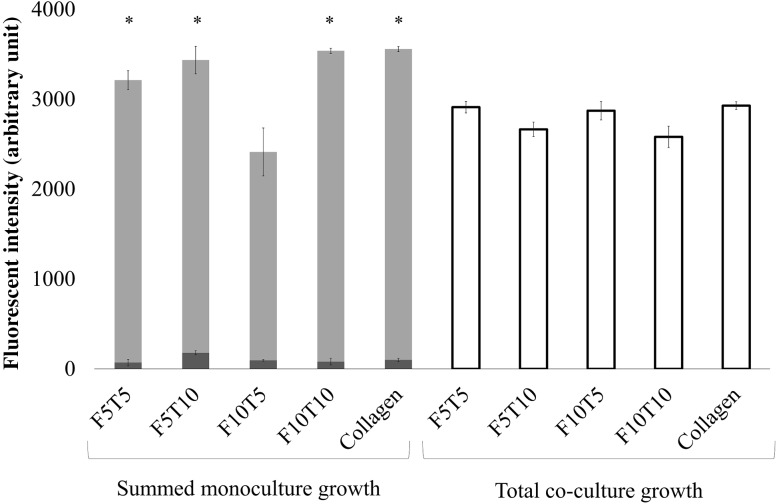
Fig. 4.
Comparing the total cell growth of fibroblast-keratinocyte co-cultures with the sum of cell growth from fibroblast and keratinocyte monocultures in 3D wound healing constructs at day 7 measured by alamarBlue® (n = 9). The dark gray bars represent fibroblast growth in monoculture, the light gray bars represent keratinocyte growth in monocultures, and the white bars represent the total cell growth in the co-cultured constructs. The x-axis shows the fibrin-bead and wound concentrations in mg/mL (when present) and the thrombin concentration used for polymerization in units/mL. The collagen concentration was 2.4 mg/mL. "Asterisks" indicates p < 0.05 when compared with cell growth in the co-cultured constructs

