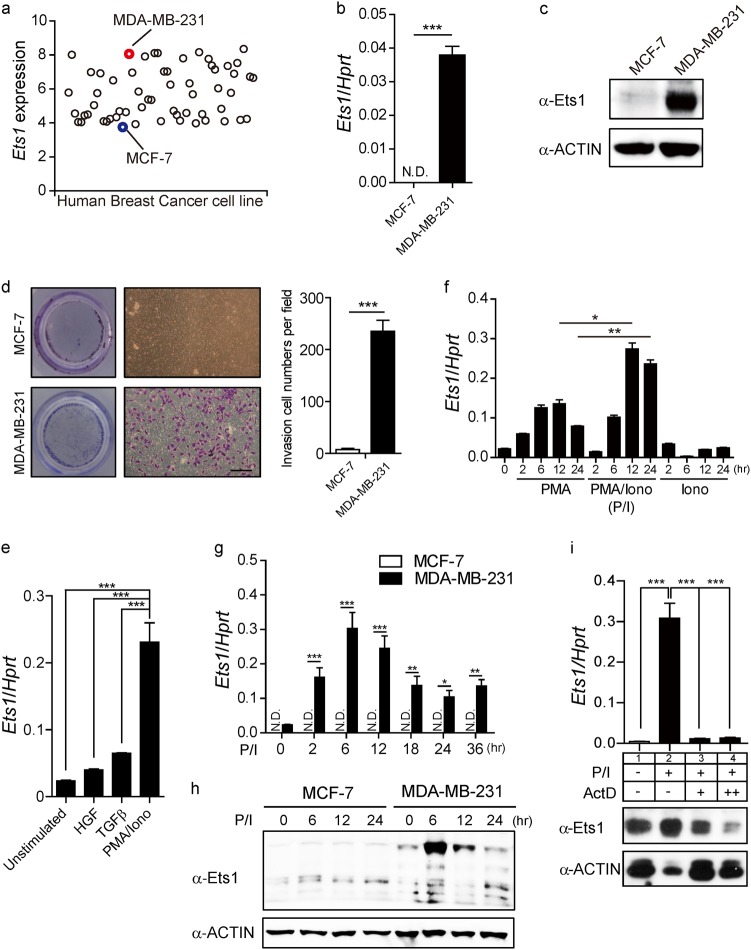
Fig. 1. Comparative analyses of Ets1 expression between metastatic MDA-MB-231 and less metastatic MCF-7 breast cancer cells.
a Analysis of Ets1 expression profile in 59 breast cancer cell lines by Cancer Cell Lines Encyclopedia (CCLE). b, c Analyses of Ets1 transcripts and protein levels by qRT-PCR (b) and Immuno-blot (c) in unstimulated condition. d Cells were stained with crystal violet and representative images were obtained from in vitro invasion assay using 10% FBS as chemoattractant. Scale bar: 100 m. e Metastatic MDA-MB-231 cells were treated with indicated stimuli for 6 h and relative levels of Ets1 transcripts normalized against Hprt are shown. f Effect of PMA (p), Ionomycin (i) and their combination (p/i) on Ets1 transcripts levels determined by qRT-PCR. g, h Comparative analysis of Ets1 transcripts and protein level between the cells in response to PMA/Ionomycin (p/i) stimulation. Data are presented as mean ± SD. Two-way ANOVA with Bonferroni post-tests showed a significant difference of Ets1 expression. i Effect of actinomycin D (Act D) treatment in MDA-MB-231 cells on Ets1 transcripts and protein levels determined by qRT-PCR and Immuno-blot, respectively. Values in b, d, f, e, and i are means ± SD. One-way ANOVA with Bonferroni correction indicated a significant difference. b–i Data shown are representative of more than three independent experiments with similar results. N.D. not detected. *p < 0.05, **p < 0.01, and ***p < 0.001

