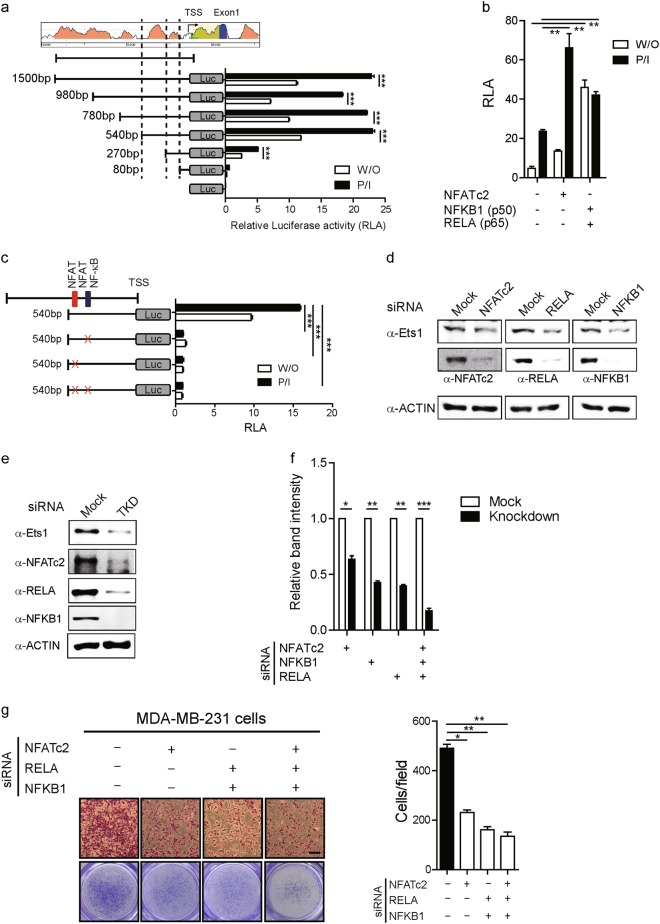
Fig. 2. Identification of core-regulatory element (CRE) and CRE-binding transcription factors involved in Ets1 expression.
a Schematic diagram of the genomic position and size of the deletion constructs of promoter region of Ets1 gene are shown. b MDA-MB-231 cells were transfected with Ets1 promoter-Luc reporter vector (540 bp) and together with indicated combinations (minus, plus) of expression vectors. Relative luciferase activity was measured. c MDA-MB-231 cells were transfected with Ets1 promoter-Luc (540 bp) vector or vectors mutated in the NFAT or NFAT/NFKB binding sites (multiply: mutation site). Relative luciferase activity in response to PMA/Ionomycin stimulation was measured. b, c Relative luciferase activities relative to the expression of Renilla luciferase plasmid (hRluc) are calculated as fold difference relative to the control value. d, e Effects of knockdown of indicated transcription factors on the expression of Ets1. MDA-MB-231 cells were transfected with mock siRNAs or siRNAs for indicated transcription factors (NFATc2, NFKB1 and RELA) (d) or triple combination of them (TKD) (d, e). Knockdown efficiency on the level of transcription factors by individual siRNAs or TKD siRNAs was confirmed by Immuno-blot (f) and band intensity of Immuno-blot was quantified by ImageJ software. g Knockdown of individual siRNAs or TKD siRNAs on invasive properties of MDA-MB-231 cells by invasion assay. Scale bar: 100 m. Data are presented as mean ± SD. One-way ANOVA with Bonferroni correction indicated a significant difference of invaded cells. a–c, f Data are presented as mean ± SD. Two-way ANOVA with Bonferroni post-tests showed a significant difference. a–g Data shown are representative of more than three independent experiments with similar results. *p < 0.05, **p < 0.01, and ***p < 0.001

