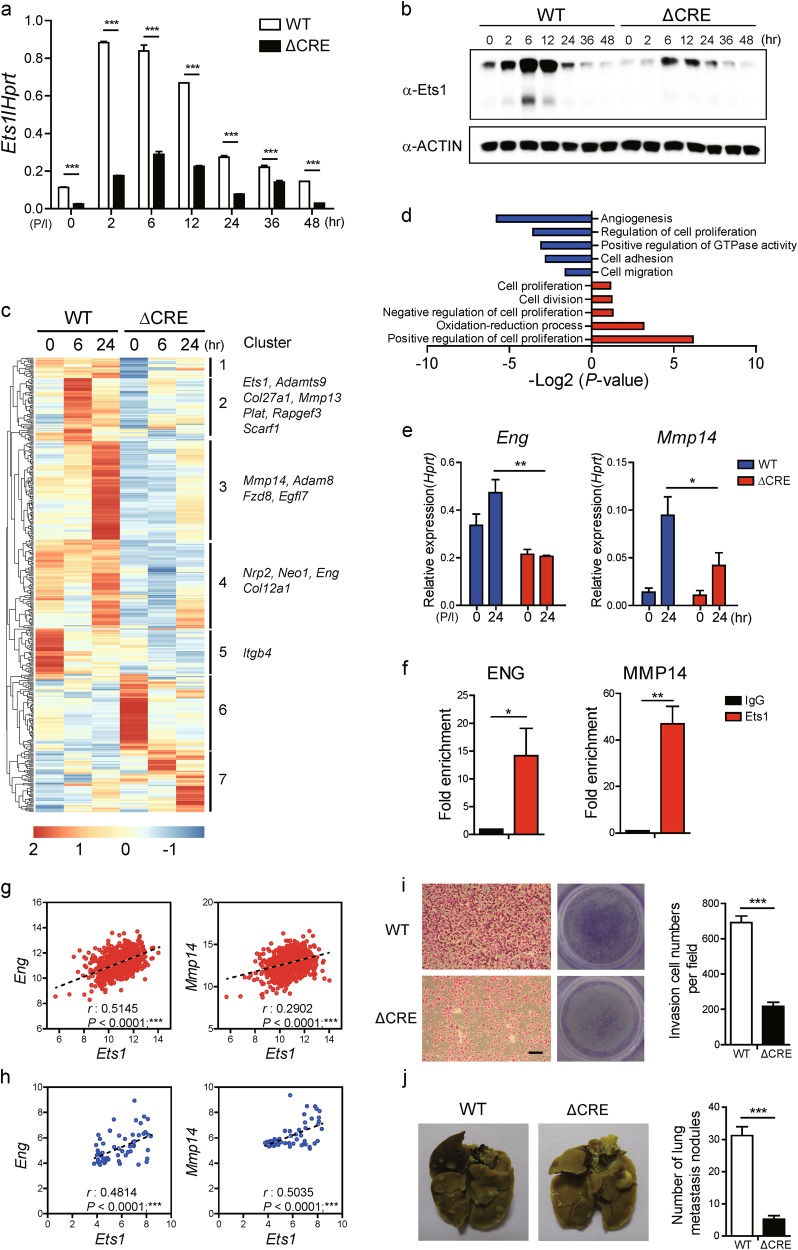
Fig. 5. Deletion of CRE region reduces Ets1 expression and tumor invasiveness.
a, b Comparative analysis of Ets1 expression levels in transcripts and protein between WT and CRE-deleted MDA-MB-231 (ΔCRE) cells determined by qRT-PCR and Immuno-blot. Transcript levels were normalized against Hprt and actin served as loading controls, respectively. Data are presented as mean ± SD. Two-way ANOVA with Bonferroni post-tests showed a significant difference of Ets1 expression. c Heatmap of RNA-sequencing data showing differentially expressed genes (DEGs) in WT and ΔCRE MDA-MB-231 cells. d GO-term enrichment using DAVID “Biological functions” category. Shown are the top five up and down-regulated functions based on –log2(p value). e Comparison of expression levels of Ets1 target genes between WT and ΔCRE cells. f ChIP-PCR was performed to detect Ets1 enrichment on the promoter regions of Eng and Mmp14 genes in MDA-MB-231 cells 2 h after stimulation. Fold enrichment compared with input is shown. Data are representative of two individual experiments. Bars represent averages from triplicate PCR reactions as mean ± SD. One-way ANOVA with Bonferroni correction indicated a significant enrichment of Ets1; *p < 0.05; **p < 0.01; ***p < 0.001. g Scatterplots and nonparametric Spearman’s rank correlation analysis with corresponding P-values correlation analysis from TCGA. Correlation between Ets1 and target genes (Eng and Mmp14) in mRNA levels. Each symbol represents an individual BRCA sample. h Scatterplots and nonparametric Spearman’s rank correlation analysis with corresponding p-values correlation analysis from CCLE. Correlation between Ets1 and target genes (Eng and Mmp14) in mRNA levels. Each symbol represents an individual human breast cancer cell line. i Cells were stained with crystal violet and representative images were obtained from in vitro invasion assay using 10% FBS as chemoattractant. Cells were stained with crystal violet. Scale bar: 100 m. j Representative images (left) and numbers of metastasis nodules (right) of mouse lungs obtained from 6 weeks after tail vein injections of WT or ΔCRE cells (each 5 × 10⁵) into eight female nude mice, respectively. i, j Data are presented as mean ± SD. One-way ANOVA with Bonferroni correction indicated a significant difference between WT and ΔCRE cells. a, b, e, f, i, j Data shown are representative of more than two independent experiments with similar results. *p < 0.05, **p < 0.01, and ***p < 0.001 (unpaired t-test)

