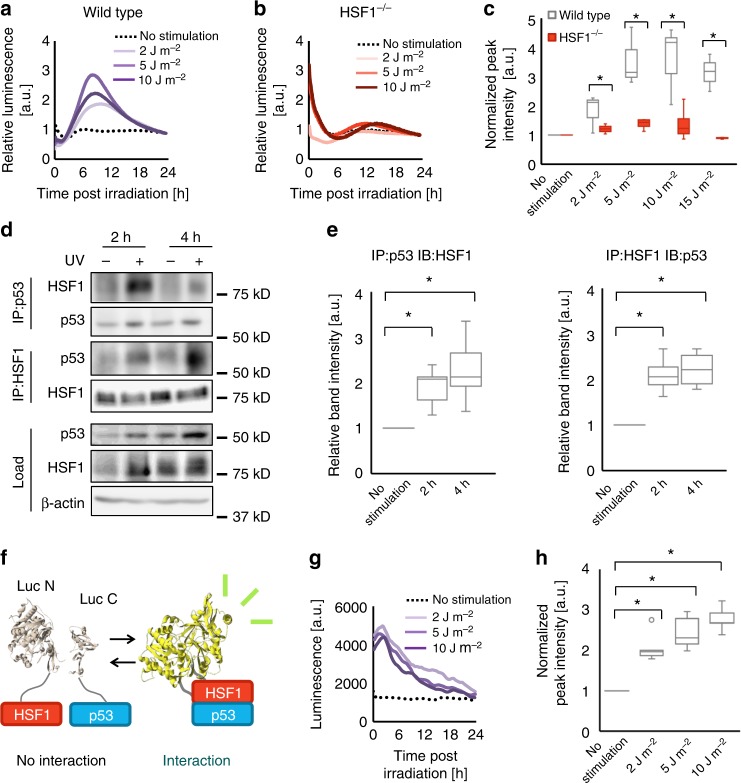
Fig. 4.
HSF1 interacts with p53 and governs p53 activation during UV-triggered clock synchronization. a–c Monitoring of p53 trans-activation with the p53RE-driven luciferase (p53RE-Luc) reporter. Dose-dependent induction of p53 activity after UV irradiation (254 nm) as monitored using NIH3T3 cells harboring the p53RE-Luc reporter (a). Dose-dependent induction of p53 activity after UV irradiation as monitored using HSF1−/− MEFs harboring the p53RE-Luc reporter (b). Comparison of dose-dependent p53RE activation between wild-type and HSF1−/− MEFs (c). n = 3. d, e Interaction between HSF1 and p53 as observed by coimmunoprecipitation. NIH3T3 cells were stimulated with UV irradiation (254 nm, 10 J m−2) and subjected to a coimmunoprecipitation assay at 2 or 4 h after stimulation. Representative blots of at least four independent experiments (d, n = 4 for the IP-HSF1 experiment and n = 5 for the IP-p53 experiment) are shown. See Supplementary Figure 14 for full-size blot images. Quantification of the band intensity of the coimmunoprecipitation assay (e). Values were normalized to the band intensity of actin in each corresponding sample and further normalized to the band intensity of the unirradiated sample. f A schematic illustrating the principle of the split-luciferase assay used to detect an interaction between HSF1 and p53. Upon their interaction, the two split fragments come into proximity with one another to reconstitute a full-length luciferase, thereby regaining a bioluminescent signal. g Split-luciferase complementation analysis after various strengths of UV irradiation. NIH3T3 cells harboring split-luciferase probes were irradiated with 2, 5, and 10 J m−2 UV irradiation. The temporal profiles of the split-luciferase reconstitution are shown. h Quantification of the maximum peak intensities relative to the non-irradiated control. n = 3. For all data, *p < 0.05 and ns not significant (p > 0.05), two-tailed t-test

