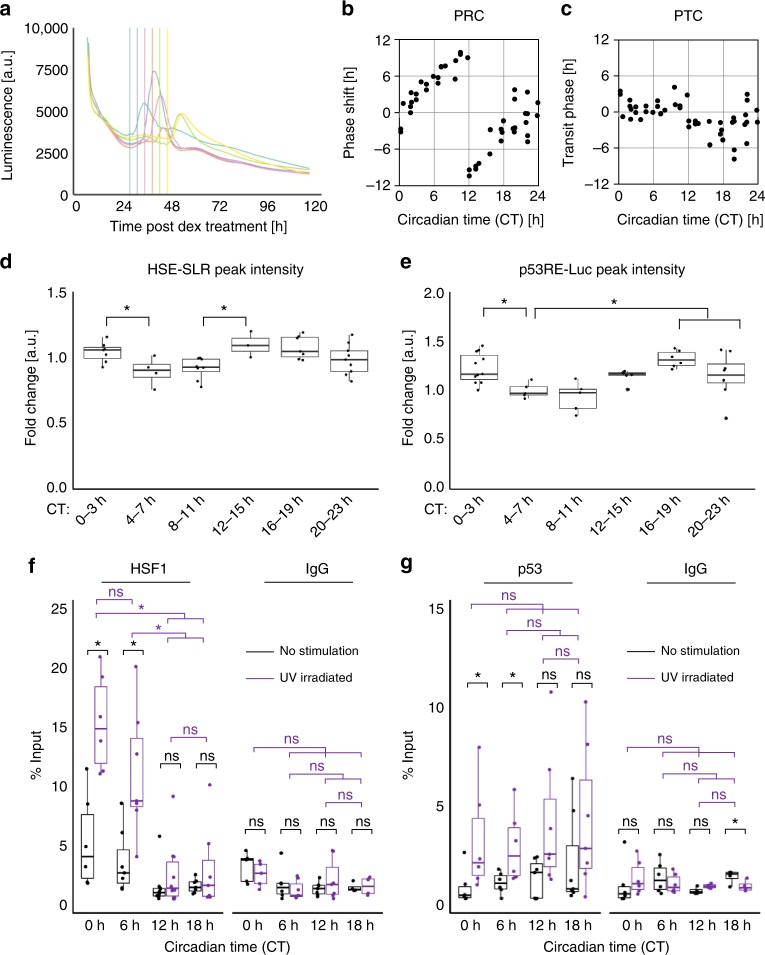
Fig. 6.
CT-dependent synchronization process upon UV irradiation. Analysis of circadian time (CT) dependency. NIH3T3 cells post synchronization by Dex (10 nM, 2 h) w ere irradiated with UV (10 J m−2) after 24–48 h of Dex treatment, defined as CT 0–24 h. For the analysis of the CT groups, values were tested by one-way ANOVA followed by a two-sample t-test. *p < 0.05, ns: not significant (p > 0.05) in two-tailed t-tests. a Representative Per2-Luc profiles for cells irradiated at 24, 28, 32, 36, 40, or 44 h with colors corresponding to the time when cells were irradiated, as shown in the vertical line with the same color. b, c The phase–response curve (b, PRC) and phase–transition curve (c, PTC) for the UV-triggered clock synchronization. Phase shifts and phase transitions were calculated using the first peak time post irradiation. d Time-dependent activation of HSF1 monitored by HSE-SLR. The CTs of the irradiation were divided into 6 groups: CTs 0–3 h, 4–7 h, 8–11 h, 12–15 h, 16–19 h, and 20–23 h. The fold change in the HSE-SLR peak intensity calculated by taking the ratio of the intensity between the peak and at the irradiated time for each CT group is shown. At least three replicates per group. ANOVA; F = 4.00, p = 6.0 × 10⁻³. e Time-dependent activation of p53 monitored by p53RE/E-box-Luc. The CTs of the irradiation were divided into six groups as in d. The fold change in the peak intensity calculated as in d for each CT group is shown. At least five replicates per group. ANOVA; F = 5.71, p = 6.0 × 10⁻⁴. f, g ChIP assay of HSE2 or p53RE on the Per2 promoter after UV irradiation. ChIP assay of HSE2 using anti-HSF1 antibody or mouse IgG as a negative control (f). ChIP assay of p53RE using anti-p53 antibody or mouse IgG as a negative control (g). There were at least six replicates for each group. Statistical values for ANOVA are listed in Supplementary Table 3

