Fig. 5.
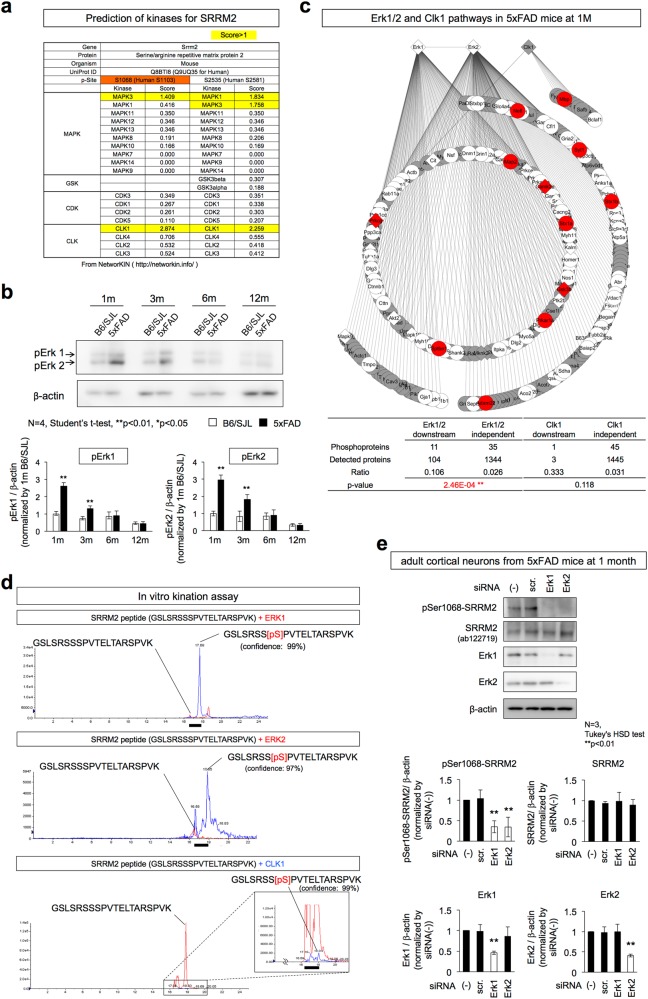
Erk1/2 phosphorylates SRRM2 at Ser1068. a Kinase prediction by NetworKIN (http://networkin.info/). Erk1/MAPK3 and Clk1 showed scores of >1.0 for Ser1068 of mouse SRRM2 and the counterpart Ser1103 of human SRRM2. b Western blot detection of Erk1/2 (MAPK3/1) in the cerebral cortex of 5xFAD mice from 1 to 12 months of age. The lower graph shows the results of quantitative analyses. c Downstream target proteins of Erk1/2 but not of Clk1 are activated in 5xFAD mice. Proteins shown in red indicate increased phosphorylation at 1 month of age in whole cerebral cortex tissues of 5xFAD mice. White: detected by mass analysis but unchanged, red: detected and increased significantly in Welch’s test with post-hoc BH procedure (p < 0.05), gray: undetected by mass analysis. Diamond: kinase protein, circle: non-kinase protein. In lower panel, the ratio of phosphorylated proteins / total proteins was compared between inside and outside of kinase downstream by Fisher’s exact test (p < 0.05). The high quality figure is posted at http://suppl.atgc.info/021/. d To confirm that these activated kinases are responsible for SRRM2 phosphorylation at Ser1068, in vitro phosphorylation was performed with SRRM2 peptide substrate (GSLSRSSSPVTELTARSPVK) and Erk1/MAPK3, Erk2/MAPK1, or Clk1 was purified followed by detection of phosphorylated substrates by mass spectrometry. The peaks in LC that were identified by MS/MS as phosphorylated or non-phosphorylated SRRM2 peptides are indicated. e SiRNA-mediated knockdown of Erk1 or Erk2 suppresses SRRM2 phosphorylation at Ser1068. Lower graphs show quantitative analyses of band signal intensities from three mice (N = 3). Double asterisks indicate p < 0.01 in Tukey’s HSD test

