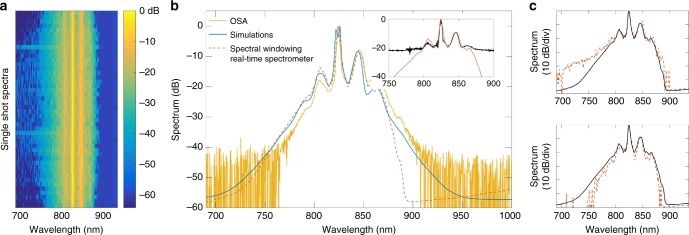
Fig. 6.
Experimentally recorded single-shot MI spectra with high dynamic range. a Series of 60 recorded spectra stacked along the vertical direction to illustrate the shot-to-shot fluctuations seen with MI. b Average spectrum measured with our high dynamic range real-time technique (dashed red), average spectrum measured with an optical spectrum analyser (yellow), and simulated average spectrum (blue). The inset shows the comparison between our 60 dB dynamic range spectral measurement (dashed red) and that using a conventional fibre-DFT with only ~22 dB dynamic range (black). c Two selected single-shot spectra from experiments (dashed red) compared with the average experimental spectrum (solid black)

