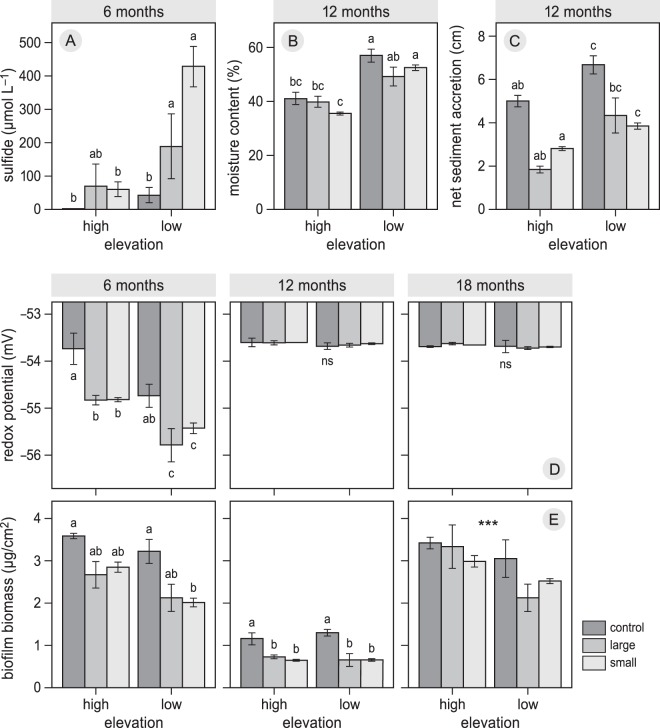
Figure 2.
The effects of die-off treatments (control, large, small) along an elevational gradient (high, low) on (A) porewater sulphide concentration (µ mol L−1), (B) sediment moisture content (%), (C) net sediment accretion (cm), (D) sediment redox potential (m V), and biofilm density (µg cm−2). Bars represent means ± SE; different lowercase letters indicate a significant deference computed for each month separately (Tukey HSD, P < 0.05). (***) Sign in May 16 of the panel (E) represents the significance (P < 0.001) between zones.

