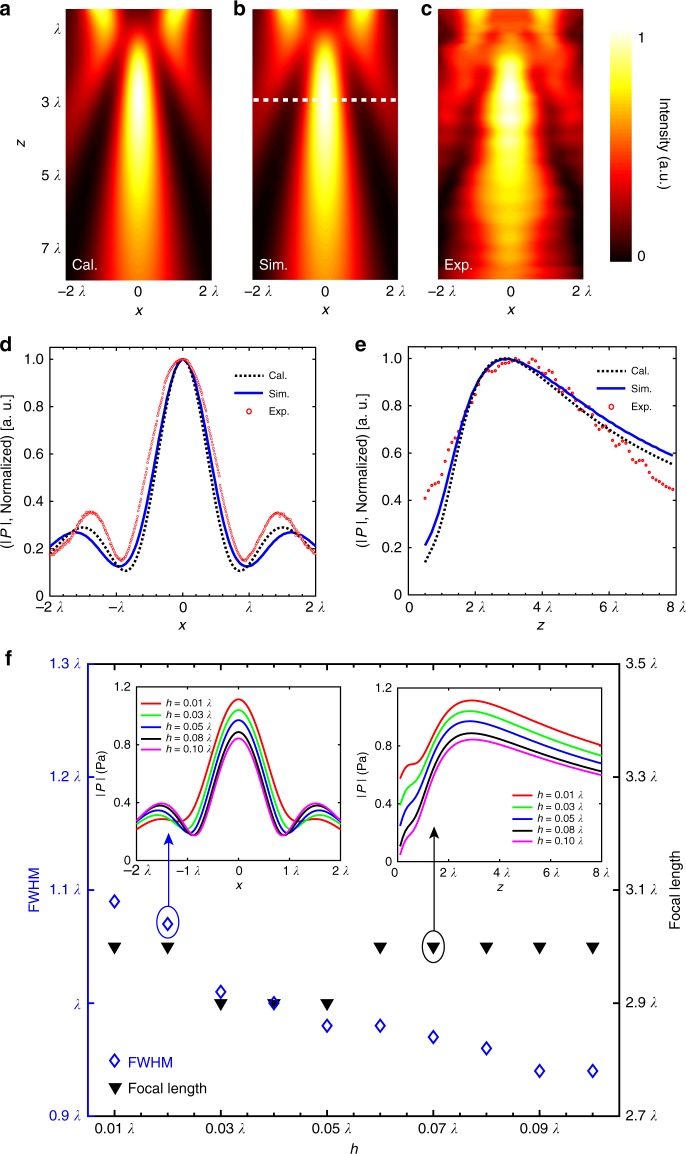
Fig. 3.
Far-field acoustic focusing. a–c Theoretical calculation, numerical simulation, and experimental measurement of the pressure field, showing the normalized intensity maps after a normally incident plane wave transmits through the optimized metasurface lens. The white dashed line denotes the designated focal length. d, e The distributions of normalized pressure amplitude in cross sections of the focal spot along x direction and z direction, respectively. f Simulated full-width at half-maximum (FWHM) and focal length with different thicknesses of the acoustic metasurface varying in the range of [0.01λ, 0.1λ]. The profiles of pressure amplitude through the focal spot are shown in the insets

