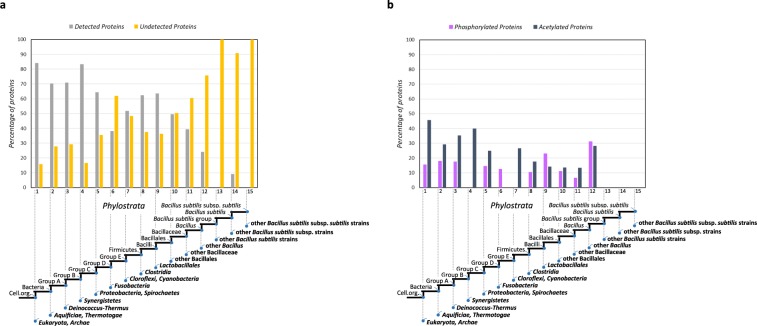
Figure 3.
The phylostratigraphy map of B. subtilis subsp. subtilis str. 168 genome depicting distribution of: (a) detected and undetected, (b) phosphorylated and acetylated proteins. Estimated evolutionary origins of individual genes are mapped on the depicted reference evolutionary tree (x-axis). All B. subtilis genes have been distributed into 15 groups (phylostrata) according to the estimated point of emergence of their protein family founders. In panel a), the y-axis denotes the percentage of detected and undetected proteins, out of the total number of proteins sorted to each phylostratum. In panel b), the y-axis denotes the percentage of modified proteins out of the total number of proteins assigned to each phylostratum.

