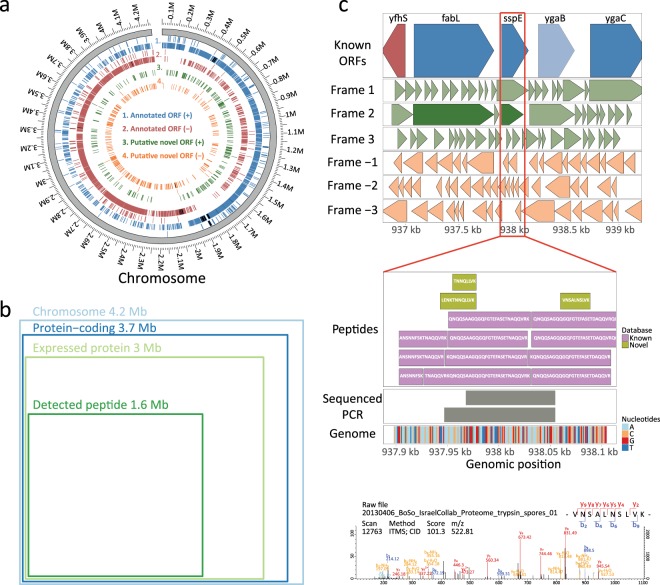
Figure 4.
MS/MS quality and genomic coverage. (a) Circos graph representation of B. subtilis genome, including the annotated and potentially novel ORFs expressed in this study. (b) Venn diagram illustrating the MS coverage at peptide and protein levels in context of B. subtilis genome. (c) The genomic region visualization for seq_51322. Top panel includes known ORFs (in blue for + strand and in red for − strand) and all ORFs generated from six-frame genome translation (in green for + strand and in orange for − strand); color lightness corresponds to whether ORF was identified or not in our data (dark color for expressed ORF and light color for non-expressed ORF). The middle panel is zoomed around the expressed novel ORF of interest for visualization of peptide sequences (in khaki are peptides mapping to novel ORF and in purple are peptides from known ORF) and RT-PCR nucleotide sequences at this genomic location. The bottom panel contains the MS/MS spectra of the top scoring novel PSM.

