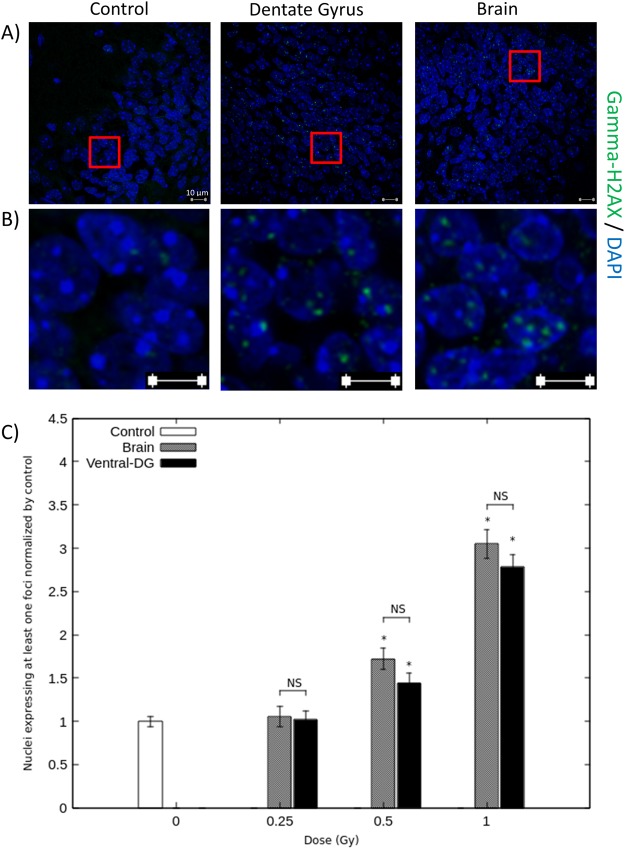
Figure 5.
Ballistic validation for ventral DG irradiation. Photomicrographs and quantifications were performed in brain section f (Fig. 3), which is supposed to be in the irradiated field following ventral DG irradiation procedure. Panel (A) shows representative photographs of gamma-H2AX staining in DG cell nuclei of control mice and of mice 1Gy irradiated at the ventral DG and brain levels. Panel (B) shows enlargements of photographs represented in panel (A). Graph (C) represents the percentage of nuclei expressing at least one gamma-H2AX staining focus in controls, ventral DG and brain irradiated animals, for each dose of IR. Data are represented as the mean ± sem of 3 animals per group and are normalized to their corresponding controls (*p < 0.05 vs controls).

