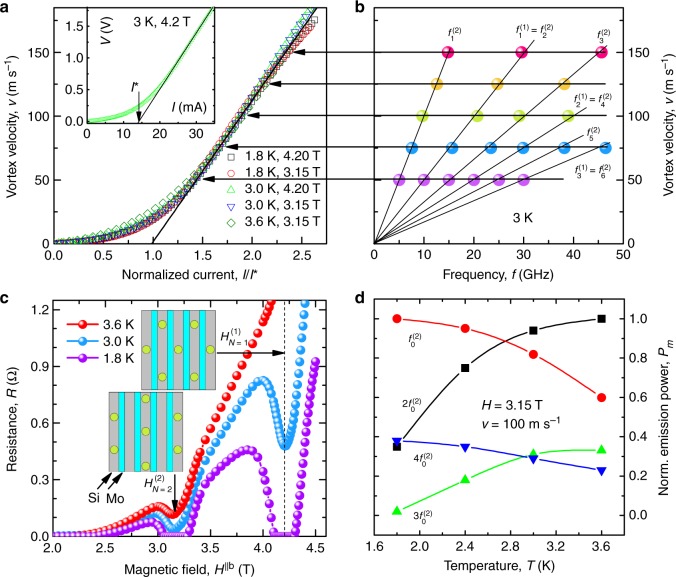
Fig. 3.
Emission frequencies and vortex lattice configurations at matching fields. a I–V curves in the vortex velocity versus normalized current representation. The horizontal arrows indicate the vortex velocities at which the emission spectra in Fig. 2 have been acquired. Inset: The I–V curve of the sample at 3 K and 4.2 T. The vertical arrow indicates the definition of I* used for plotting the I–V curves in the main panel. b Peak frequencies versus vortex velocity for the data sets (c, d) of Fig. 2. c Resistance as a function of H||b for a series of temperatures, as indicated. The vortex lattice configurations, which commensurate with the Mo/Si superlattice at T and T, are shown in the scaled coordinate system (γa, c) in the inset. d Normalized emission power Pm as a function of temperature for the first four lowest-order harmonics GHz emitted at the vortex velocity v = 100 m s−1 at 3.15 T. Solid lines are guides for the eye

