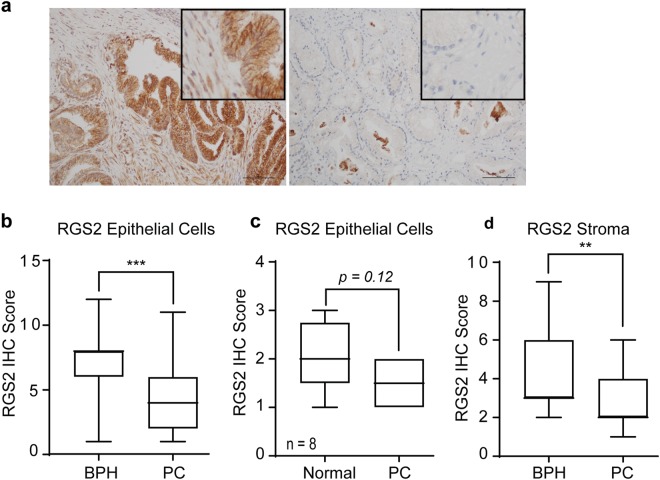
Figure 1.
RGS2 protein expression in patient specimens. RGS2 Immunohistochemistry (IHC) staining of TURP specimens. (a) Representative images of RGS2 expression in BPH and hormone-naïve PC specimens in stage T1b, showing the expression pattern of epithelial and stromal cells. Bar = 100 µm. (b) Quantitative comparisons of RGS2 expression of epithelial cells of BPH (n = 36) and PC (n = 28) (p < 0.00001, by Mann-Whitney test). (c) Intra sectional RGS2 difference in RGS2 expression between PC areas and adjacent normal areas (n = 8) (p = 0.12, Wilcoxon W paired test). (d) Quantitative comparison of RGS2 staining in BPH (n = 36) and PC associated stroma (n = 27) (p = 0.007, Mann-Whitney test).

