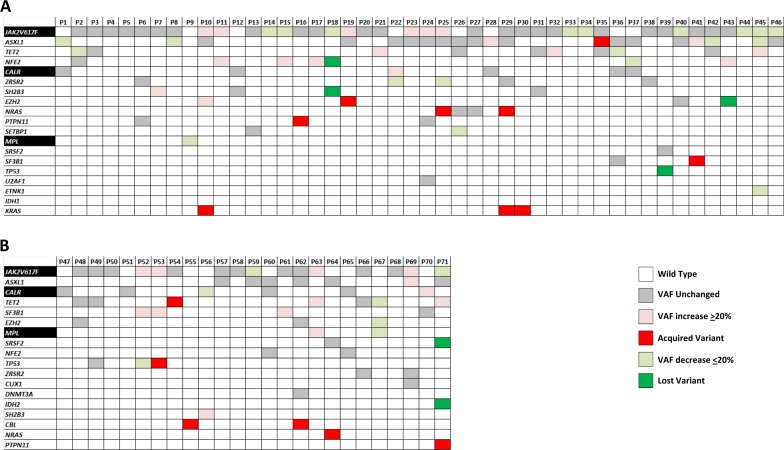
Fig. 1. Landscape plot of mutations in the study population.
Each column represents an individual patient. a: ruxolitinib treated patients; b: HU-treated patients. color code: gray indicates a mutation detected at baseline that remained unchanged at the latest follow-up sample; pink colour indicates a mutation whose VAF increased of at least 20% compared to baseline; red colour indicates a newly acquired mutation at follow-up; light green colour indicates a mutation whose VAF decreased of at least 20% compared to baseline; green colour indicates a mutation that, while detected at baseline, was no longer detected in the follow-up sample

