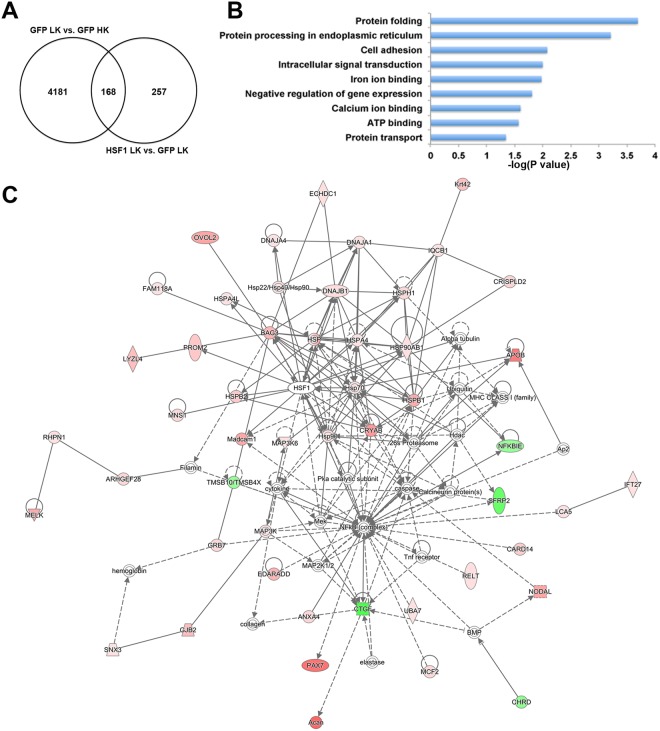
Figure 3.
Genes regulated by HSF1 in LK-treated CGNs. (A) A total of 425 genes were regulated by HSF1 in LK compared to the control, GFP LK. As shown in the Venn diagram, 168 of these DEGs were also found altered by LK treatment in GFP control sample (vs. GFP HK). (B) Gene Ontology analysis showed that the 425 HSF1 target genes were involved in various biological processes, including protein folding, protein processing in endoplasmic reticulum, and intracellular signal transduction. The top protein network that these DEGs participate in functions in cellular assembly and organization, cellular compromise, and post-translational modification (C). Red color represents upregulation by HSF1 while green color indicates downregulation. The color intensity shows the degree of level change. Proteins in white shapes do not belong to our data set but have relationships with our proteins in the network.

