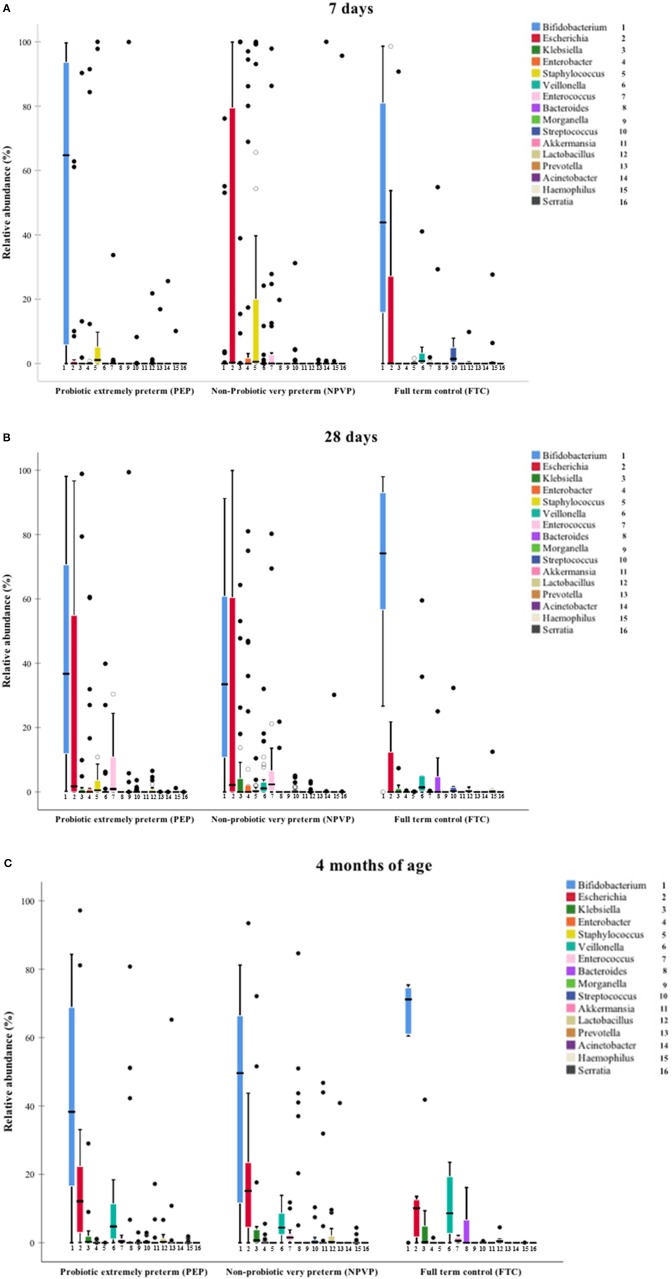
Figure 2.
(A–C) Median relative abundance of dominant taxa at genus level. Box plot diagram where the inside bar represent median, the outer horizontal line of the box represents the 25th and the 75th percentile. (A) Median relative abundance at 7 days. (B) Median relative abundance at 28 days. (C) Median relative abundance at 4 months.

