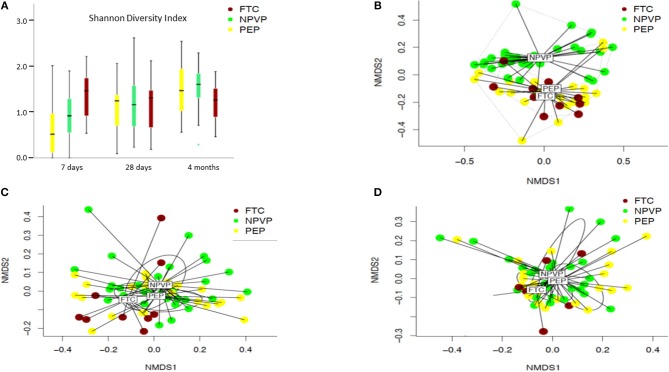
Figure 3.
(A–D) Alpha diversity calculated by Shannon diversity index and beta diversity between PEP, NPVP, and FTC infants calculated by non-metrical multidimensional scaling (NMDS). Box plot diagram where the inside bar represent median, the outer horizontal line of the box represents the 25th and the 75th percentile. Error bars represent the standard error. Differences between groups at a given time point and at different time points were tested with linear mixed model. (A) Shannon diversity index of three groups of infants at three sampling points. (B) Beta diversity (NMDS) at 7 days. (C) Beta diversity (NMDS) at 28 days. (D) Beta diversity (NMDS) at 4 months.

