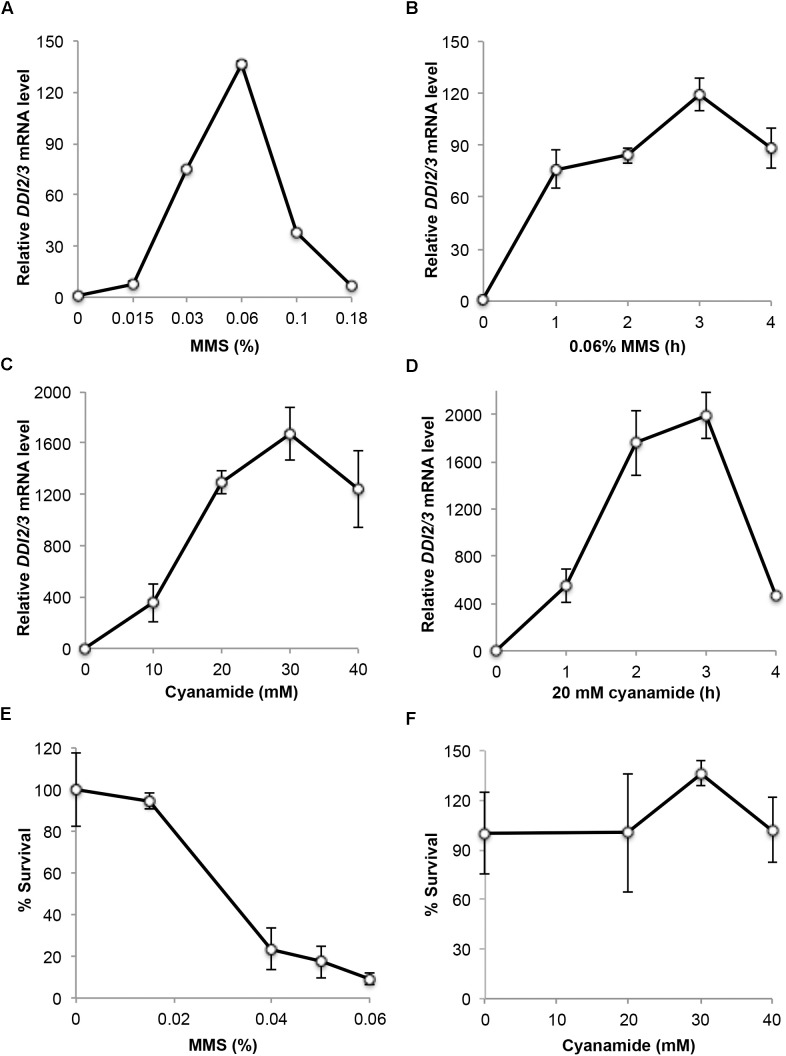
FIGURE 1.
Characterization of endogenous DDI2/3 gene expression and induction. (A–D) Endogenous DDI2/3 gene expression in BY4741 cells was measured by qRT-PCR with DDI2/3-specific primer pairs 5′-GTTGTTCCGCCTCCAAACAGTG-3′ and 5′-CTGCATAGTCCTGATTTCCACC-3′. The yeast UBC6 mRNA was used as an internal control (Teste et al., 2009). The relative DDI2/3 mRNA level with untreated cells in each experiment was set as 1. (A) Dose response to MMS treatment for 2 h. (B) Time course response to 0.06% MMS. (C) Dose response to CY treatment for 2 h. (D) Time course response to 20 mM CY. (E) Cell survival after MMS treatment at the given doses for 2 h. (F) Cell survival after CY treatment at the given doses for 2 h. All data are an average of at least three independent experiments with standard deviations shown as error bars.

