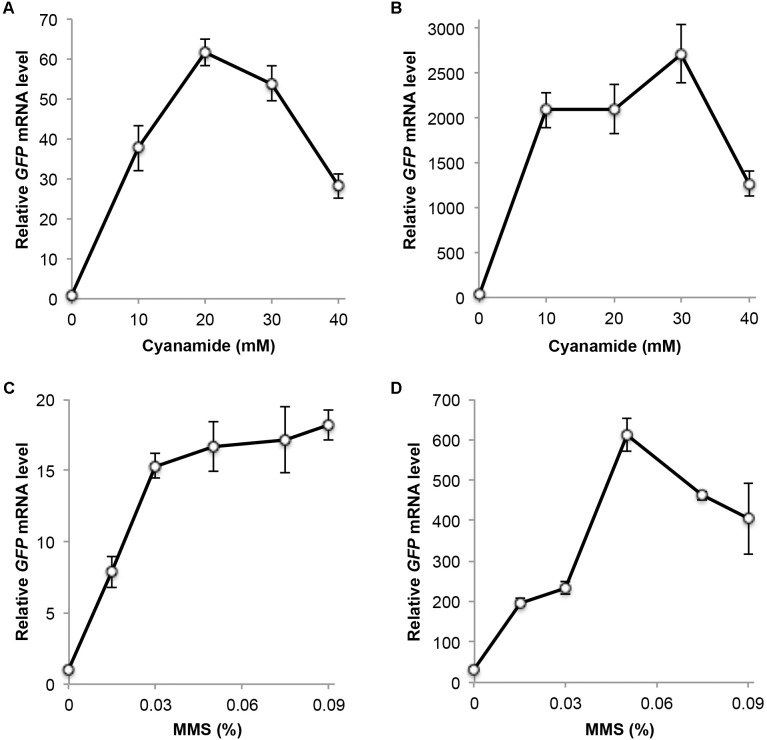
FIGURE 3.
Relative GFP transcript levels measured by qRT-PCR. (A) Cells harboring plasmid YCpU-PDDI2-GFP in response to CY treatment. (B) Cells harboring plasmid YEpU-PDDI2-GFP in response to CY treatment. (C) Cells harboring plasmid YCpU-PDDI2-GFP in response to MMS treatment. (D) Cells harboring plasmid YEpU-PDDI2-GFP in response to MMS treatment. qRT-PCR was performed as described in Section “Materials and Methods” with GFP-specific primer pairs 5′-TCCGTTCAACTAGCAGACCA-3′ and 5′-GCCATGTGTAATCCCAGCAG-3′. The yeast UBC6 mRNA was used as an internal control. The relative GFP mRNA level with untreated YCpU-PDDI2-GFP cells was set as 1. All data are an average of at least three independent experiments with standard deviations shown as error bars.

