FIGURE 5.

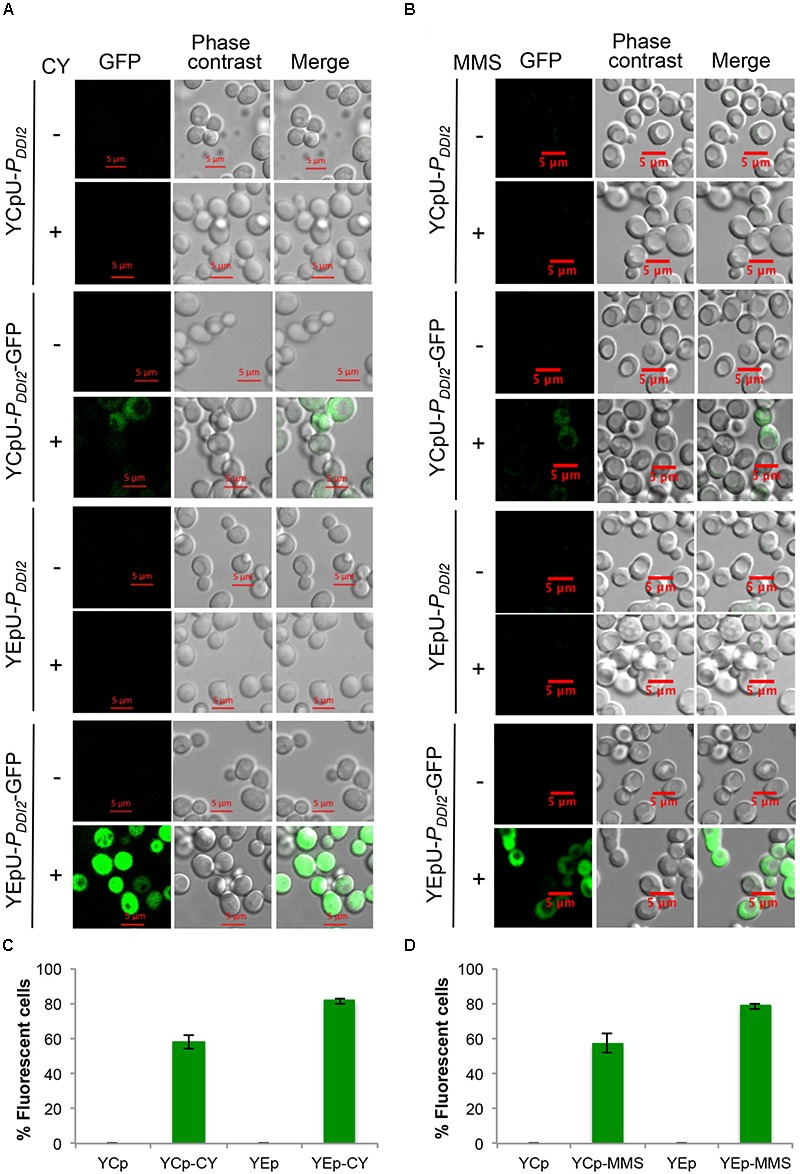
Fluorescent microscopic analysis of BY4741 transformants harboring PDDI2-GFP plasmids. (A) Representative images of cells with or without 20 mM CY treatment for 2 h. (B) Representative images of cells with or without 0.015% MMS treatment for 2 h. Plasmids are indicated on the left panel. (C,D) Quantitative analysis of percentage of fluorescent cells as shown in (A,B), respectively. Cells transformed with empty vectors without the GFP gene are all negative for fluorescence and the data are not shown in the graphs.
