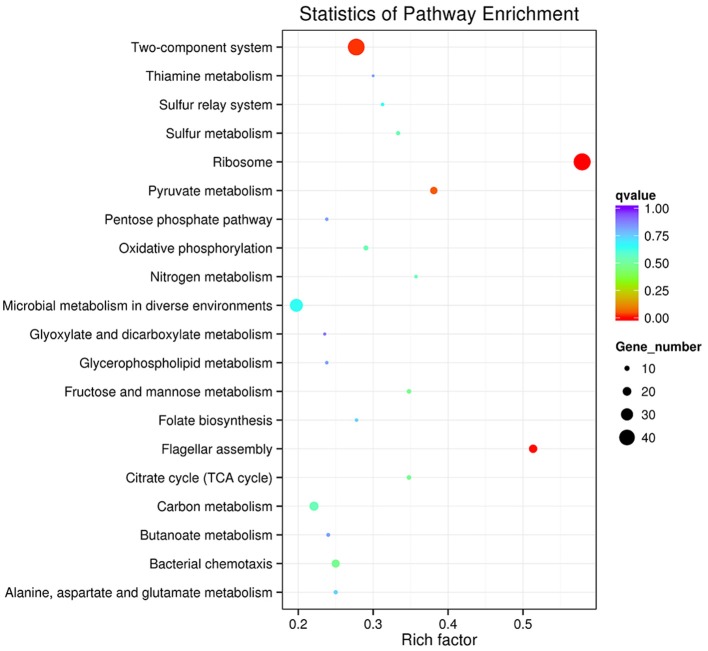
Figure 6.
The Top20 pathways with the most significant p-value. The x-axis indicates percentages of DEGs belonging to the corresponding pathway. The left y-axis represents the top 20 pathways. The sizes of the bubbles represent the number of DEGs in the corresponding pathway, and the colors of the bubbles represent the enrichment p-value of the corresponding pathway. KEGG terms with P-value < 0.05 were considered significantly enriched by differential expressed genes.

