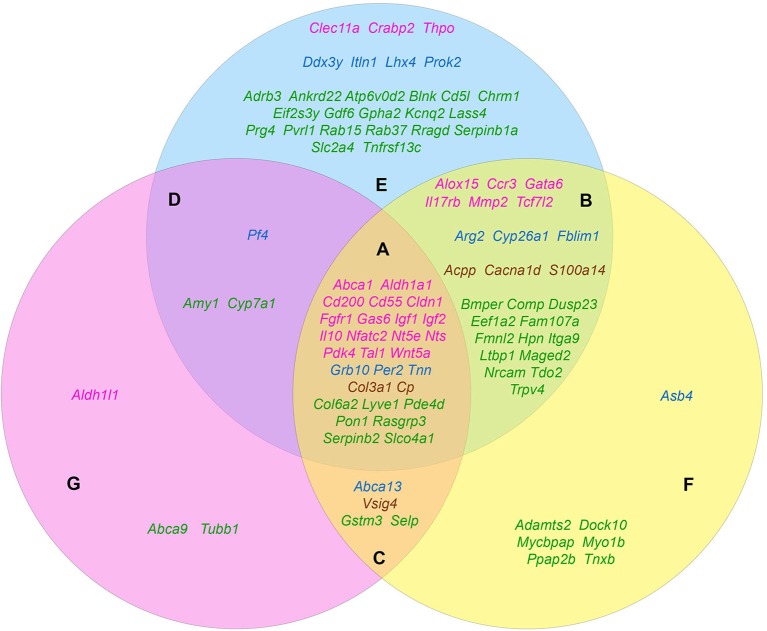
Figure 1.
The distribution pattern of genes, overexpressed in TAMRA+ Krebs-2 carcinoma cells relative to TAMRA− cells, to functional groups. The blue area corresponds to the proliferative self-sufficiency, yellow, to invasiveness and metastasis; pink, to drug resistance. (A–F) Sections indicate the subgroups of the genes with regard to their multi-functionality: (A) the most multi-functional genes contributing to all three properties; (B) genes contributing to proliferative self-sufficiency and invasive growth/metastasis; (C) genes contributing to drug resistance and metastatic phenotype; (D) genes contributing to proliferative self-sufficiency and drug resistance; (E) genes contributing to proliferative self-sufficiency; (F) genes contributing to invasive growth and metastasis; (G) genes contributing to drug resistance. The genes symbols are indicated in different colors in accordance with their proven functional role in the formation of the stem or stem-like phenotype of normal pluri-/multipotent as well as tumor stem cells: pink denoting genes that are known markers of both normal pluri-/multipotent and tumor stem cells; blue, known markers of normal pluri-/multipotent stem cells; brown, known markers of tumor stem cells; green, genes for which their participation in the formation of stemness has not been proven at all.

