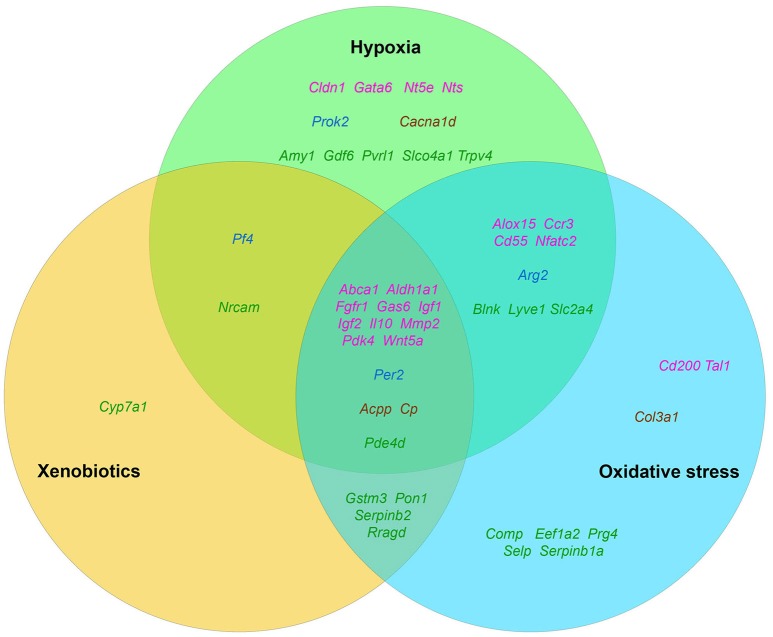
Figure 2.
The distribution pattern of genes, overexpressed in TAMRA+ Krebs-2 carcinoma cells relative to TAMRA− cells, with regard to their activation in response to appropriate stimulus. The green area corresponds to hypoxia, blue–to oxidative stress, orange–to xenobiotics. The genes symbols are indicated in different colors in accordance with their proven functional role in the formation of the stem or stem-like phenotype of normal pluri-/multipotent as well as tumor stem cells: pink denoting genes that are known markers of both normal pluri-/multipotent and tumor stem cells; blue–known markers of normal pluri-/multipotent stem cells; brown–known markers of tumor stem cells; green–genes for which their participation in the formation of stemness has not been proven at all.

