Figure 1.
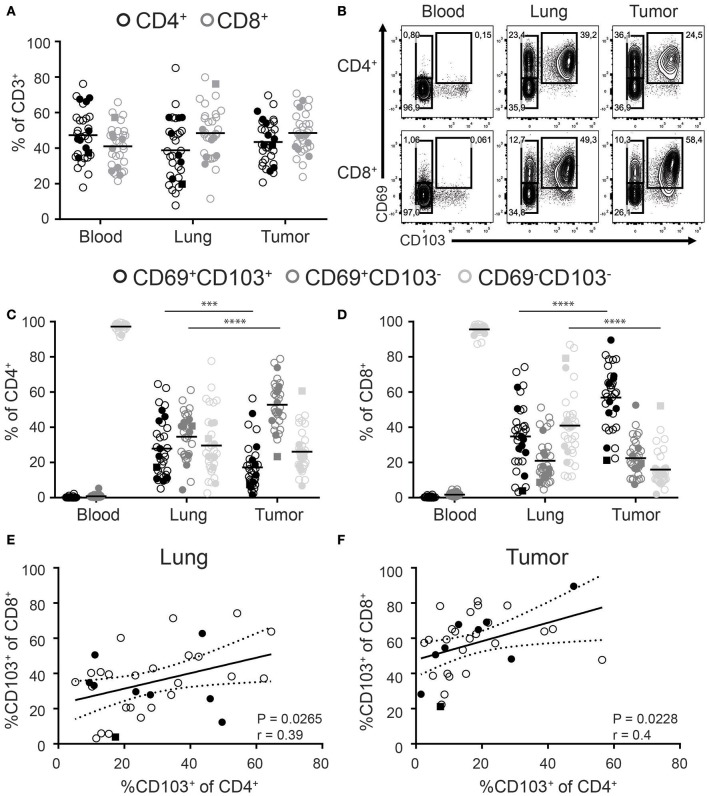
Distribution of CD103 and CD69 expression on CD4+ and CD8+ T cells of paired blood, lung, and tumor samples. (A) Frequencies of CD4+ (black circles) and CD8+ (gray circles) cells of total CD3+ T cells of paired blood, lung, and tumor tissue was analyzed by flow cytometry. (B–D) The expression of CD69 and CD103 was analyzed on paired blood, lung and, tumor CD4+ and CD8+ T cells. (B) Contour plots show representative examples of CD69 and CD103 expression on blood (left panels), lung (middle panels), and tumor (right panels) CD4+ (top panels) and CD8+ (bottom panels) T cells. (C,D) Frequencies of CD103+CD69+ (black circles), CD103−CD69+ (dark gray circles), and CD103−CD69−(light gray circles) cells of total blood, lung, and tumor CD4+ (C) and CD8+ (D) T cells were quantified. (E,F) Correlation between CD103+CD8+ and CD103+CD4+ lung (E) and tumor (F) T cells was determined. (A–F) n = 33. Open circles, solid circles, solid square indicate adeno-, squamous, and large cell carcinoma, respectively. (A,C,D) Quantifications are shown as dot plots with the horizontal line indicating the mean and each point represents a unique sample. (E,F) Correlation shown as X-Y graph where each point represents a unique sample. (C,D) ***p < 0.001, ****p < 0.0001; 2-way analysis of variance (ANOVA) with Tukey's multiple comparisons test. (E,F) r, Pearson's rank coefficient; p < 0.05.

