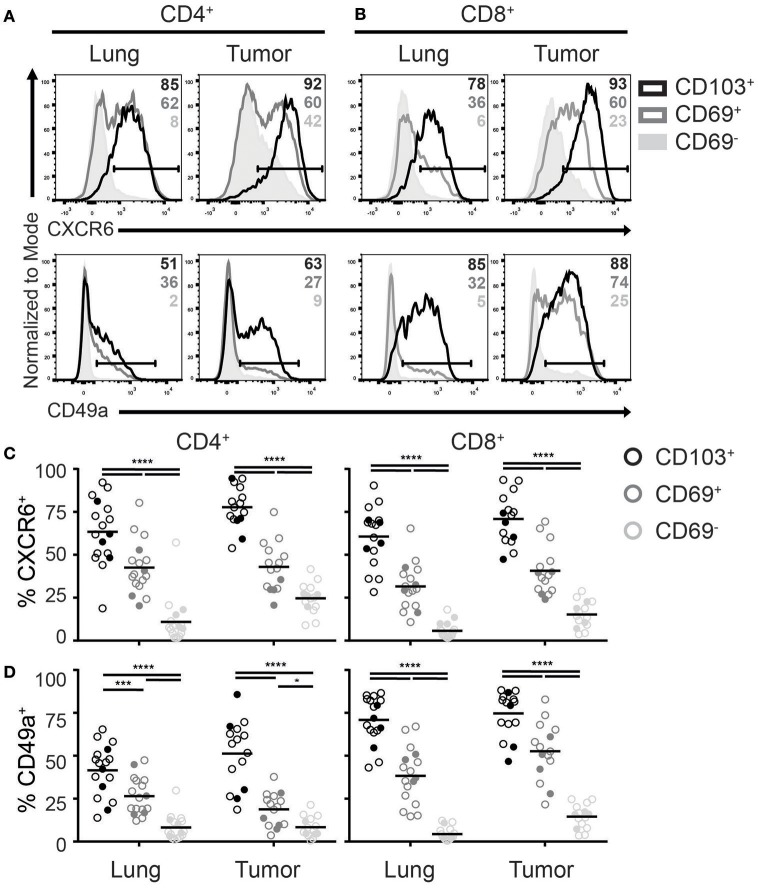
Figure 3.
Expression of TRM homing molecules by TILs. (A-D) The expression of chemokine receptor CXCR6 and integrin CD49a were analyzed on CD4+ and CD8+ TRM and TILs. The expression of CXCR6 (top panels) and CD49a (bottom panels) on lung (left panels) and tumor (right panels) CD4+ (A) and CD8+ (B) T cell subsets is shown by representative histogram overlays (maximum set to 100%) (CD103+ black, CD69+ dark gray, CD69− solid light gray). The frequencies of CXCR6+ (C) and CD49a+ (D) CD103+ (black circles), CD69+ (dark gray circles), and CD69− (light gray circles) cells of lung and tumor CD4+ T cells (left graphs) and CD8+ T cells (right graphs). (C,D) The quantifications are shown as dot plots with the horizontal line indicating the mean and each point represents a unique sample. n = 15–17. Open circles and solid circles indicate adeno- and squamous carcinoma, respectively. *p < 0.05, ***p < 0.001, ****p < 0.0001; 2-way ANOVA with Tukey's multiple comparisons test.

