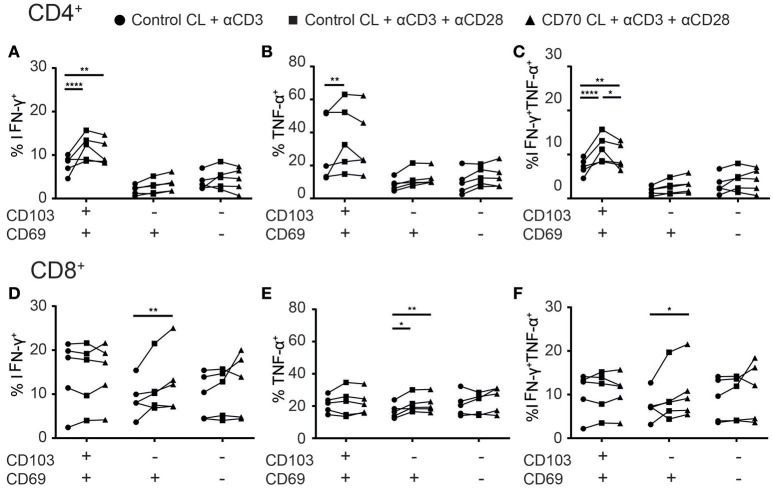
Figure 7.
Co-stimulation enhances cytokine production of TILs. (A–F) The effect of co-stimulation on cytokine production of TILs was assessed with overnight stimulation. (A–C) The frequencies of IFN-γ+ (A), TNFα+ (B), or TNF-α+IFN-γ+ (C) CD103+, CD69+, and CD69− CD4+ TILs stimulated with αCD3 with control cell line (CL) (black circles), αCD3 and αCD28 with control CL (black squares), or αCD3 and αCD28 with CD70-expressing CL (black triangles) was quantified. (D–F) The frequencies of IFN-γ+ (D), TNFα+ (E), or TNF-α+IFN-γ+ (F) CD103+, CD69+, and CD69− CD8+ TILs stimulated with αCD3 with control CL (black circles), αCD3 and αCD28 with control CL (black squares), or αCD3 and αCD28 with CD70-expressing CL (black triangles) was quantified. n = 5. *p < 0.05, **p < 0.01, ****p < 0.0001; 2-way ANOVA with Tukey's multiple comparisons test.

