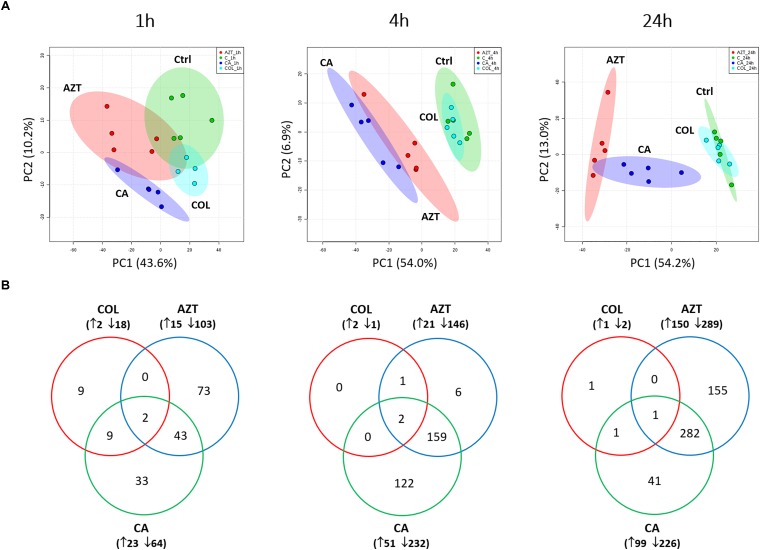
FIGURE 1.
Multivariate and univariate analyses of global metabolic changes. (A) PCA score plots of the first two principle components for metabolite levels in A. baumannii AB090342 after treatments with colistin, aztreonam alone and the combination at 1, 4, and 24 h. Each dataset represents a total of 20 samples of 5 biological replicates under each condition. Green, untreated control (C); cyan, colistin alone (COL); red, aztreonam (AZT) alone; blue, combination (CA). (B) Venn diagrams show the number of significantly affected metabolites by each treatment at 1, 4, and 24 h. Significant metabolites were selected based on FDR < 0.05, p < 0.05 and FC ≥ 2 (one-way ANOVA).

