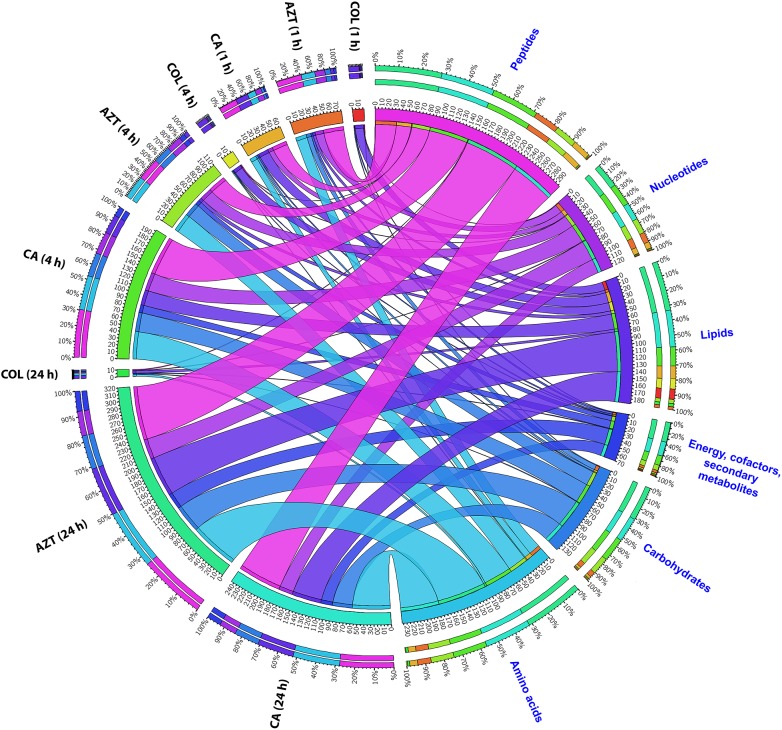
FIGURE 2.
Metabolomic responses of A. baumannii AB090342 after the treatment with colistin (COL), aztreonam (AZT) and the combination (CA) at 1, 4, and 24 h. Bipartite graph shows the correlations of the total number and percentage of significantly affected metabolites (FDR < 0.05, p < 0.05 and FC > 2) in different major classes and all conditions (treatments and time points).

