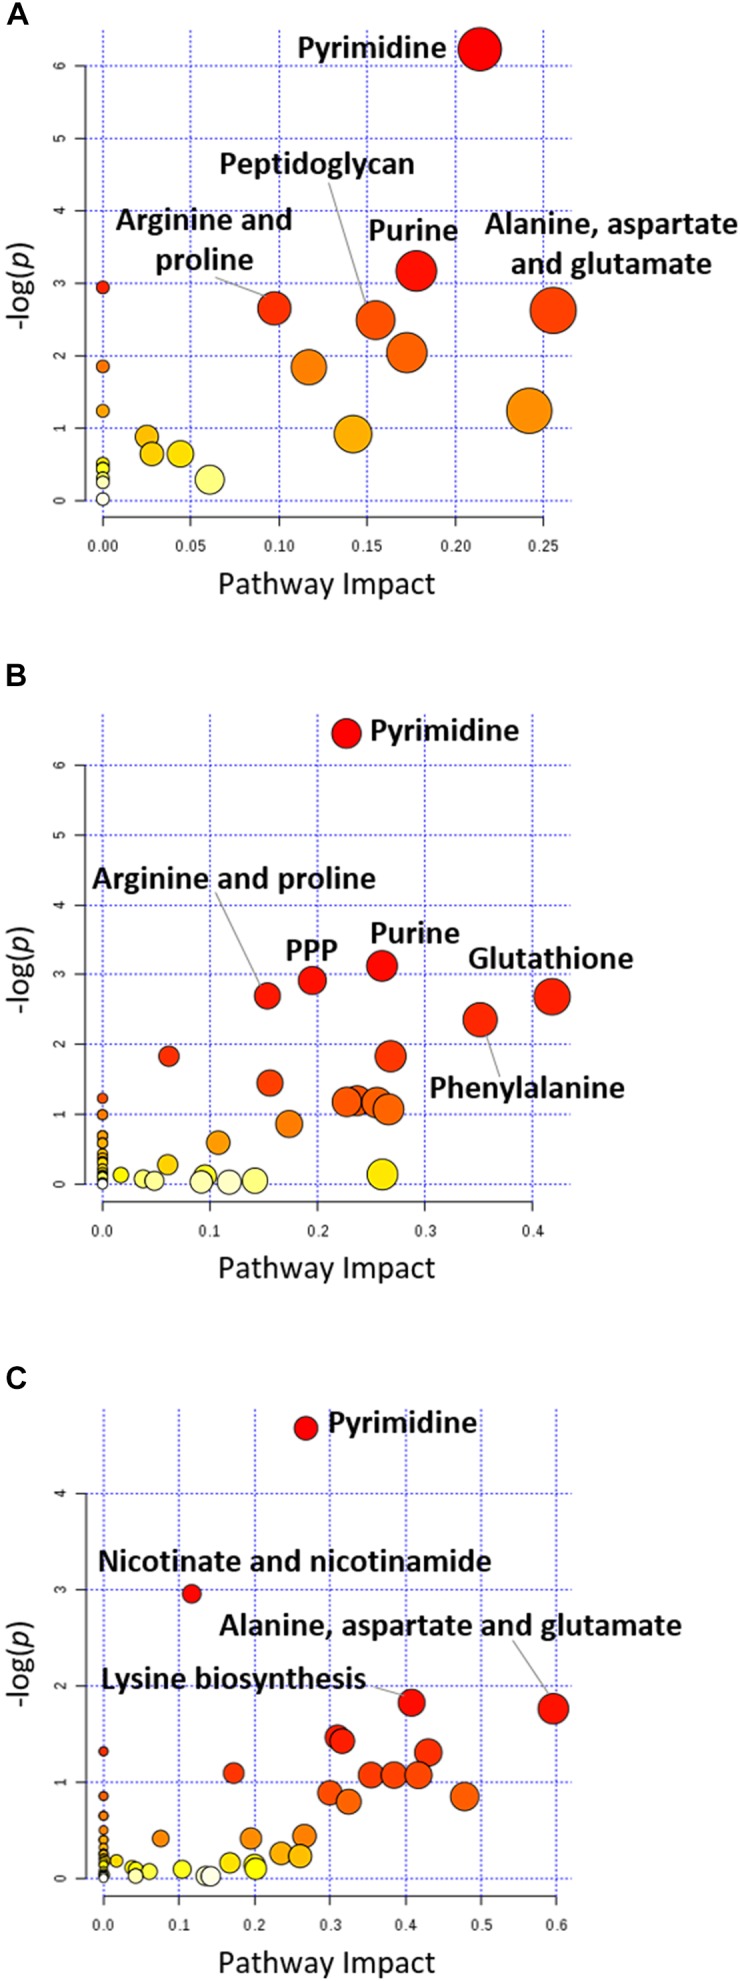
FIGURE 4.

Pathway analysis of significantly affected metabolites in A. baumannii AB090342 following the treatments with colistin, aztreonam alone and the combination at (A) 1 h, (B) 4 h, and (C) 24 h (FDR < 0.05, p < 0.05 and FC ≥ 2, one-way ANOVA). The pathway enrichment analysis was based on KEGG Pathway (http://www.genome.jp/kegg/pathway.html) with reference to Escherichia coli K-12. The figure was generated by MetaboAnalyst 4.0 (https://www.metaboanalyst.ca/).
