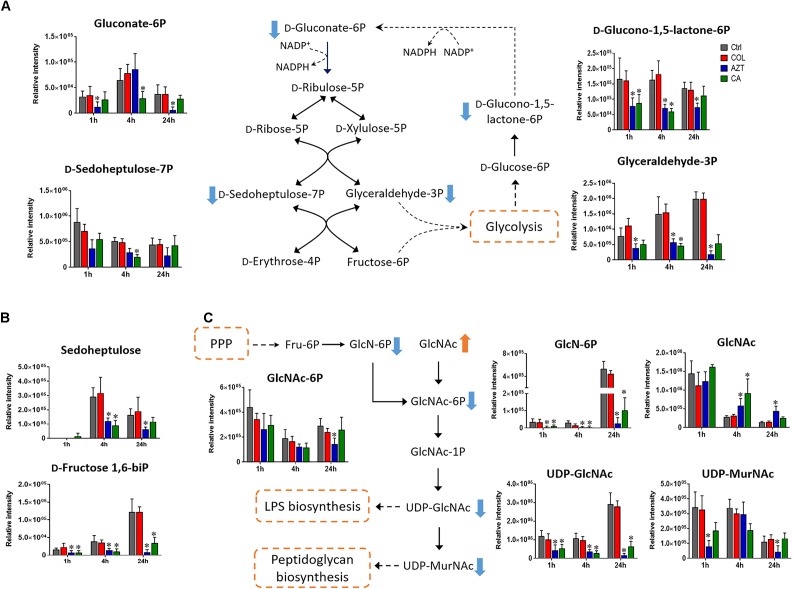
FIGURE 5.
Metabolic changes in (A) pentose phosphate pathway (PPP), (B) metabolites associated with PPP and carbon fixation, and (C) amino sugar metabolism in A. baumannii AB090342 after the treatment with colistin (COL, red), aztreonam (AZT, blue) and the combination (CA, green) compared to untreated control (Ctrl, gray) at 1, 4, and 24 h. The pathway flow charts were adapted from KEGG Pathway (http://www.genome.jp/kegg/pathway.html) with reference to Escherichia coli K-12. Orange and blue arrows indicate that the metabolites were significantly increased and decreased, respectively. ∗FDR < 0.05, p < 0.05 and log2 FC ≥ 1 or ≤ –1 (one-way ANOVA).

