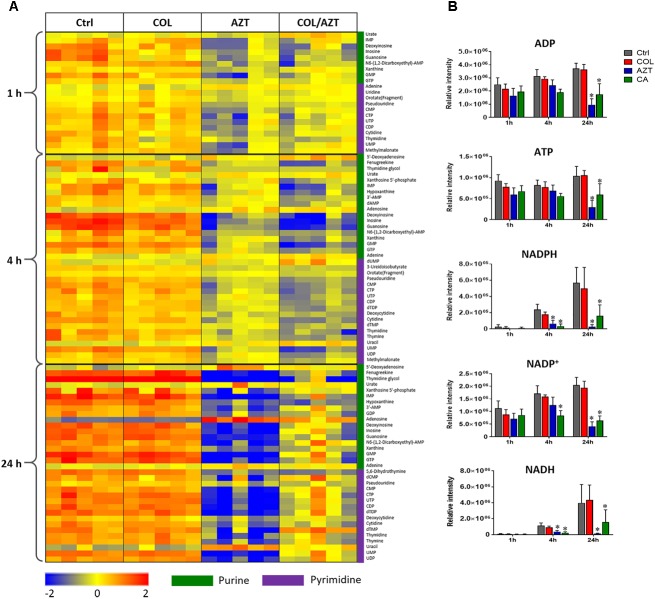
FIGURE 7.
Perturbations of nucleotide metabolism. (A) Heatmap profiles of the relative abundance of nucleotide metabolites after treated with colistin (COL), aztreonam (AZT) and the combination (COL/AZT) at 1, 4, and 24 h. (B) Significantly altered metabolites associated with nucleotide metabolism due to aztreonam alone and the combination of colistin and aztreonam at 1, 4, and 24 h in A. baumannii AB090342. ∗log2 FC ≥ 1 or ≤ –1, p < 0.05, FDR < 0.05 (one-way ANOVA). Metabolomics data were collected from five biological replicates per condition.

