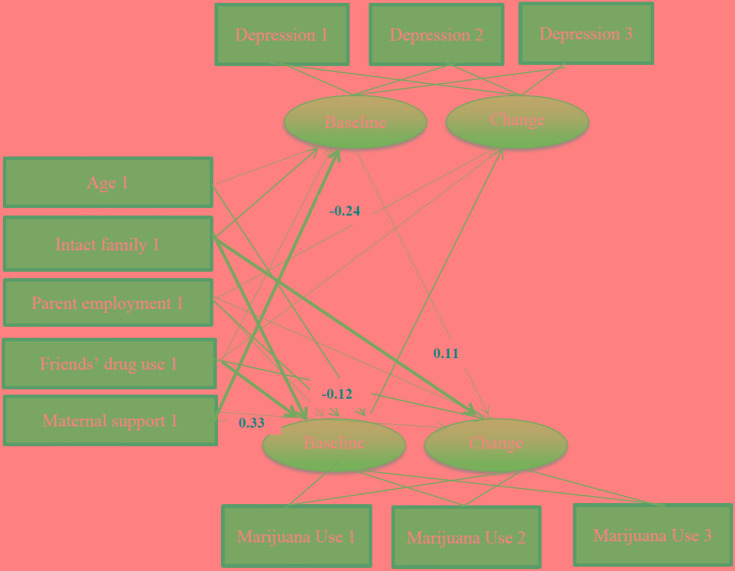
FIGURE 2.
Summary of path coefficients among female African American adolescents [χ2 = 138.037, p < 0.001, df = 40, χ2/df = 3.451. Root Mean Squared Error of Approximation (RMSEA) = 0.060]. Numbers reflect standardized regression coefficients that are adjusted for other variables. Bold paths reflect significant effects.

