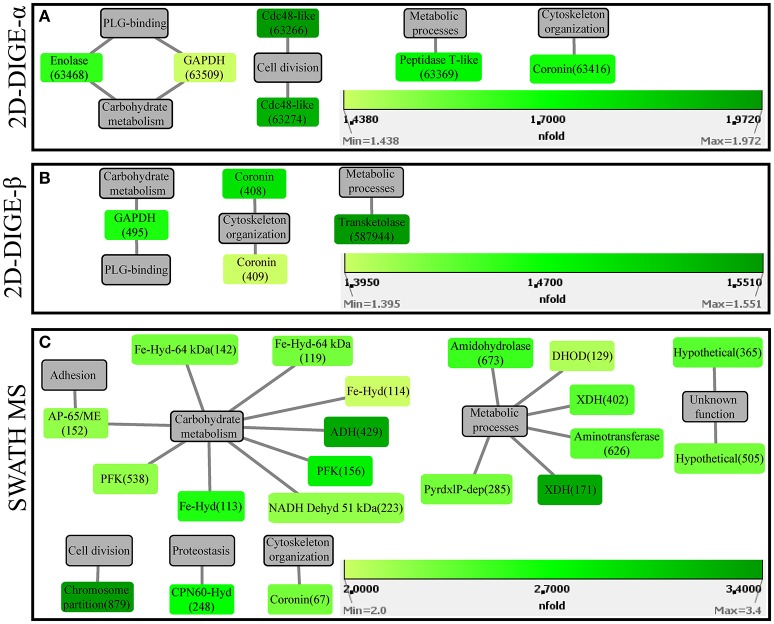
Figure 4.
Protein-function network graphs of Histomonas meleagridis-specific proteins detected as significantly overexpressed in the attenuated strain by the 2D-DIGE-α (A), 2D-DIGE-β (B), and SWATH MS (C) experiments. The protein identifications are displayed as color-coded source nodes, with their edges connected to gray colored target nodes which represent the proposed functions. The numbers in parentheses represent the identification numbers assigned to each protein by Delta2D software version 4.7 (Decodon GmbH, Greifswald, Germany) and SWATH MS experiment. In each panel, the dialogs on the right lower corners are the green colored gradient which was selected to represent the fold upregulation values of overexpressed proteins from the attenuated strain. The source nodes were color-coded based on the fold upregulation data associated with each significantly differentially expressed protein (Tables 2–4). The network layout was manually determined. The reader is referred to Tables 2–4 for explanation of abbreviated protein names. 2D-DIGE, two-dimensional differential gel electrophoresis; SWATH MS, sequential window acquisition of all theoretical mass spectra mass spectrometry.

