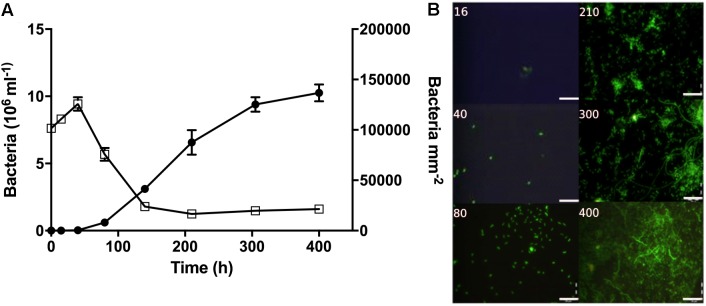
FIGURE 4.
Bacterial abundance and morphology over time during the colonization experiment. (A) Bacterial abundance on filter surfaces (circles; cells mm-2) and in the surrounding water (open squares; cells × 106 mL-1). (B) Representative pictures showing bacterial growth on the filter surfaces. Time (h) is noted on each picture. Scale bars = 20 μm.

