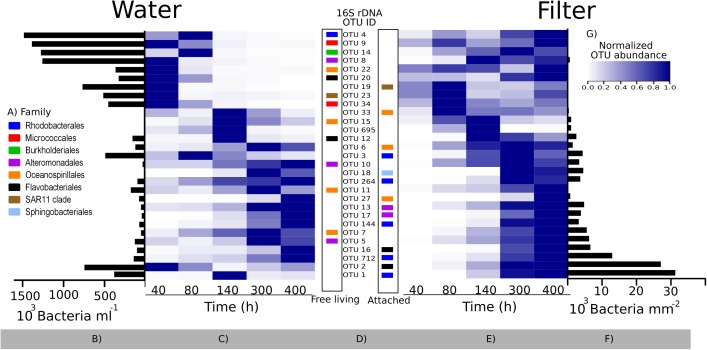
FIGURE 6.
Bacterial community succession over time in the colonization experiment based on 16S rRNA gene sequencing. Relative abundances of the 29 most predominant operational taxonomic units (OTUs; representing >80% of reads in one or more samples) were normalized by multiplying with total bacterial abundance in each sample (see text). (A) Family taxonomy key; (B,F) maximum abundances of each OTU during the experiment in the surrounding water and on filters, respectively; (C,E) heatmaps showing each OTU normalized to its maximum abundance (B,F); (D) OTU IDs corresponding to the heat map lines, with the color code showing their taxonomy. The placement of the colored squares indicates the isolation source of its closest marine BLAST hit (left = free living; right = attached to surfaces; see also Supplementary Table S5). (G) Color key for heatmaps. Note the difference in scale and unit for (B,F).

