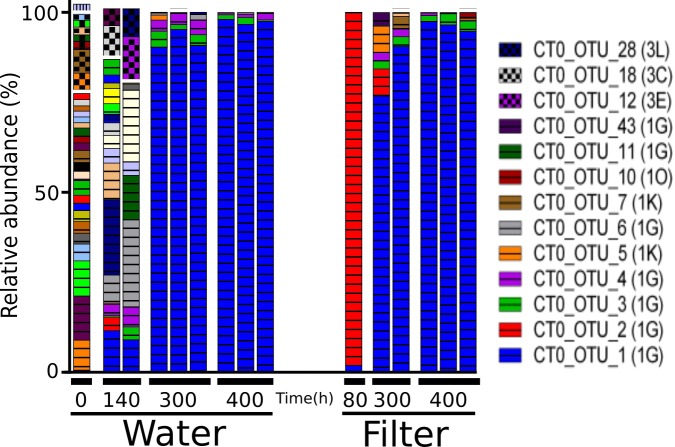
FIGURE 7.
Relative abundance of the main nifH gene based operational taxonomic units (OTUs) each accounting for > 1% of reads in any sample in the colonization experiment. Only selected OTU labels are shown. NifH gene clusters are marked by horizontal lines (Cluster I) and checkered pattern (Cluster III), and vertical lines (Cluster IV). NifH subclusters according to Zehr et al. (2003) are indicated and the phylogenetic assignments are: 1G and 1O (unassigned); 1K (Beta-Proteobacteria); Subclusters of nifH Cluster III are putative anaerobic bacteria. BLAST hits for predominant OTUs are shown in Supplementary Table S3. In some cases, less than the maximum number of replicates per sample is shown since amplification was unsuccessful for single replicates.

