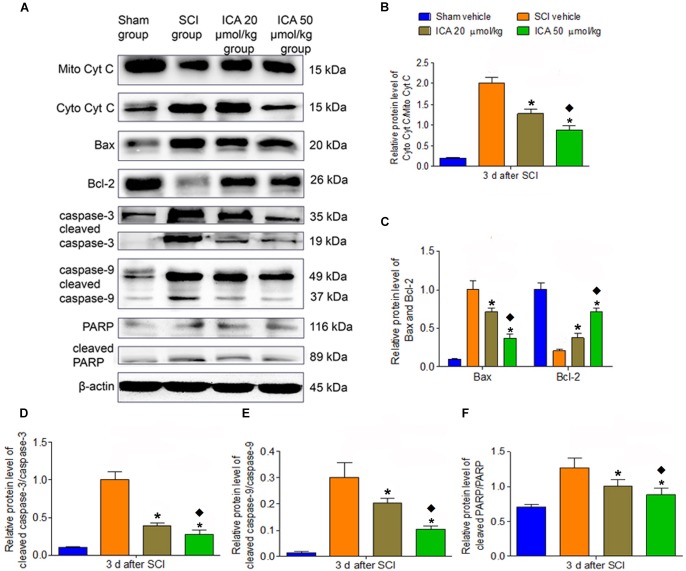
FIGURE 4.
Western blot assay. (A) The expression of mitochondrial apoptotic proteins. (B–F) The relative level of cytoplasm Cyt C/mitochondria, Bax/Bcl-2, cleaved caspase-3/caspase-3, cleaved caspase-9/caspase-9 and cleaved PARP/PARP all significantly increased in the SCI group. However, the treatment of ICA decreased the relative level. The level of proteins was decreased significantly by ICA 50 μmol/kg. N = 6. ∗P< 0.01 compared to SCI group;  P< 0.01 compared to 20 μmol/kg group.

