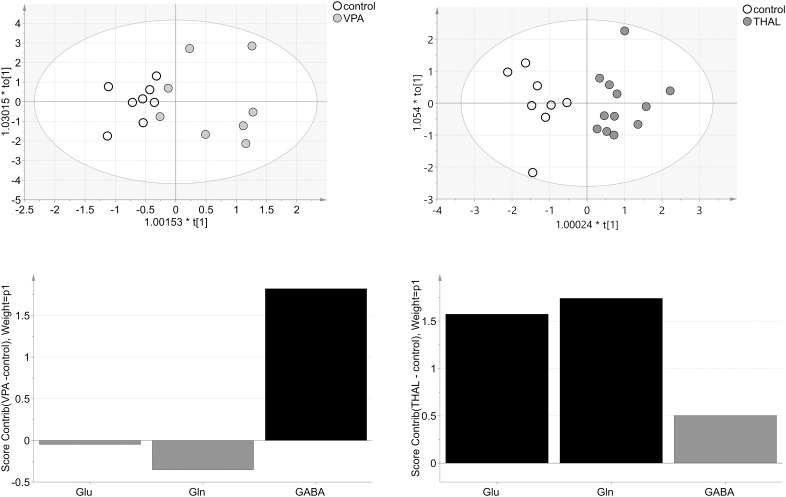
FIGURE 11.
The score plots of the two-component OPLS-DA model for NMR data for VPA and THAL vs. control group; to[1] represents variation within class for the first orthogonal component, whereas t[1] represents variation between classes for the first predictive component. Ellipse represents Hotelling T2 with 95% confidence. Lower graphs are the score contribution of differences of VPA vs. control and THAL vs. control. Black is assigned to compounds with VIP > 1. Positive value means greater concentration than control and negative means lower.

