
FIGURE 2.
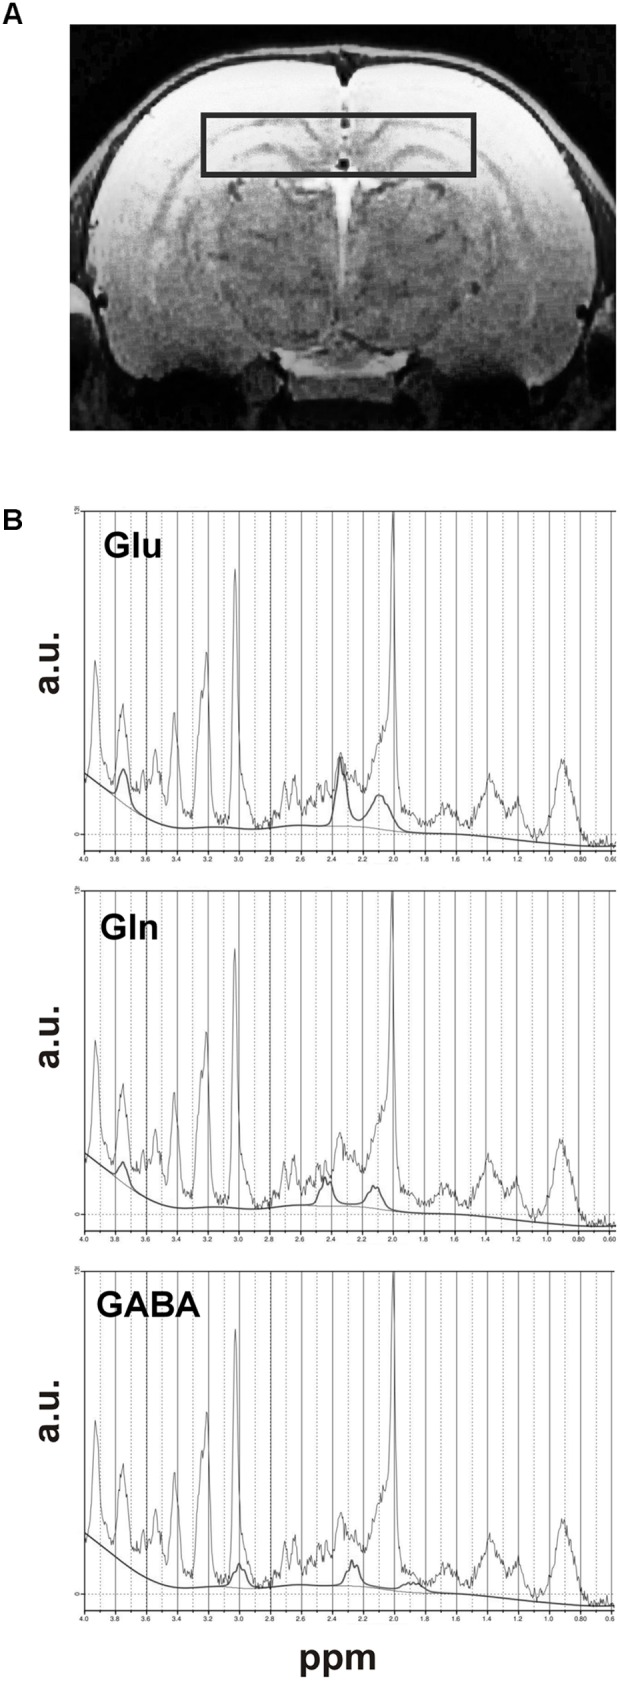
Dorsal hippocampus: (A) MRI scan showing VOI of brain used for MRS studies and (B) the graphs presenting an example of MRS spectra of Glu, Gln, and GABA signals with fitted lines.
Official websites use .gov
A
.gov website belongs to an official
government organization in the United States.
Secure .gov websites use HTTPS
A lock (
) or https:// means you've safely
connected to the .gov website. Share sensitive
information only on official, secure websites.
Dorsal hippocampus: (A) MRI scan showing VOI of brain used for MRS studies and (B) the graphs presenting an example of MRS spectra of Glu, Gln, and GABA signals with fitted lines.